By JAMES P. HARTNETT
Director of the Energy Resources Center, University of Illinois at Chicago Circle, and a member of the Illinois Energy Resources Commission, he has his Ph.D. in mechanical engineering from the University of California at Berkeley, 1954. The author acknowledges the capable assistance of Paul M. Galen and Alan Meyer of the staff of the Energy Resources Center in the preparation of this article.
Energy use profile for Illinois can guide conservation policy
ILLINOIS, an energy-rich state, has 5.4 per cent of the nation's population but accounts for a smaller share, 5.0 per of the national energy usage. An "energy profile" comparing the use of energy on a per capita basis in Illinois and the United States shows that:
1. Illinois consumes less energy than the national average for industry (including agriculture) and transportation.
2. Illinois consumes more energy than the national average for residential and commercial purposes.
|
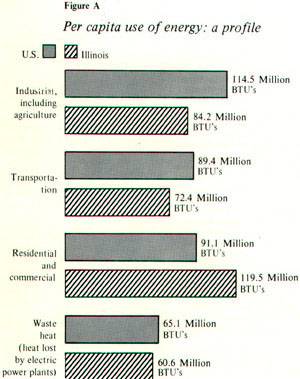
NOTE: U.S. per capita total is 360.1 million BTU's; Illinois per capita total is 336.7 million BTU's
Source: Table 1. Per capita use of energy, 1971-1973, in millions of BTU's
|
3. In total, Illinois consumes less energy than the national average.
Such a profile analyzing the pattern of energy use in the United States and in Illinois may suggest where there are significant possibilities lor energy conservation. Figure A is an example of such a profile, illustrating the consumption of millions of BTU's per capita in 1973. (A BTU—British thermal unit —is the quantity of heat required to raise the temperature of one pound of water one degree Fahrenheit when the water is at or near 60° F. One million BTU's is the energy equivalent of seven gallons of petroleum.) Table 1 gives the data used in preparing Figure A; it provides data for 1971 through 1973.
Illinois compared to nation
Figure B presents a visual comparison of energy usage patterns in the United Stales and in Illinois. It is apparent from Figure 3 that:" the United' States as a whole transportatiol accounts for approximately 25 per cent of the energy used, industry for 32 per cent, residential and commercial for 25 per cent, and heat wasted in producing electricity, 18 per cent. Compared to the country as a whole, Illinois residents use a smaller share of their total energy for transportation (22 to 25 per cent), industrial purposes (25 to 32 per cent), and a much larger share for residential-commercial
|
168 / Illinois Issues/June 1975
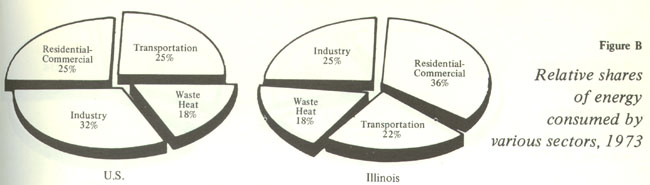
purposes (36 to 25 per cent).
The comparison of the transportation energy consumption is of particular significance and gives strong evidence of the importance of public transportation in energy conservation. According to Richard M. Michaels and Arnold B.
|
Table 1
Per Capital use of energy, 1971-1973
(in millions of BTU's *)
|
|
1971 |
|
1972 |
|
1973 |
|
| |
U.S. |
Ill. |
U.S. |
Ill. |
U.S. |
Ill. |
| Residential and commercial |
84.1 |
111.8 |
87.3 |
114.8 |
91.1 |
119.5 |
| Industrial** |
107.3 |
77.9 |
110.7 |
81.4 |
114.5 |
84.2 |
| Transportation |
82.8 |
66.6 |
86.8 |
72.3 |
89.4 |
72.4 |
| Waste heat from electric power |
58.5 |
55.1 |
61.5 |
60.8 |
65.1 |
60.6 |
| Total |
332.7 |
311.4 |
346.3 |
329.3 |
360.1 |
336.7 |
*One million BTU's is the energy equivalent of approximately 7 gallons of petroleum.
**Includes agriculture.
Sources: U.S. energy data—U.S. Department of the Interior. Illinois energy data—1971, 1972, Department of Interior; 1973 estimate based on sources given in Table 3. Population data—Statistical Abstract of the U.S. 1974. U.S. Department of Commerce.
|
Table 2
Estimated annual gross state product by contributing division in order of importance
(figures in millions of dollars)
|
|
1970
|
1971
|
1972
|
1973
|
| Gross State Product |
$60,216 |
$64,462 |
$69,758 |
$77,585 |
| 1. Manufacturing |
18,750 |
19,159 |
21,247 |
23,679 |
| 2. Wholesale and retail trade |
10,429 |
11,169 |
11,640 |
12,472 |
| 3. Finance, insureance |
7,978 |
8,784 |
9,315 |
10,309 |
| 4. Services and other |
7,259 |
7,852 |
8,359 |
9,129 |
| 5. Government |
5,263 |
6,281 |
6,832 |
7,299 |
| 6. Transportation, communication and utilities |
5,263 |
5,840 |
6,538 |
7,042 |
| 7. Contract construction |
3,075 |
3,431 |
3,440 |
3,786 |
| 8. Farming |
1,357 |
1,544 |
1,968 |
3,425 |
| 9. Mining |
409 |
402 |
419 |
444 |
Source: Illinois Economic Data Book, 1973, Illinois Department of Business and Economic Development.
Maltz (Energy Problems in Illinois, Proceedings of the First Illinois Energy Conference, 1973) 85 per cent of all work trips to Chicago are accomplished by public transportation. This fact undoubtedly accounts for a significant portion of the lower transportation energy consumption in Illinois. If Illinois residents used energy for transportation at the same level as the national average, an additional 80,000 barrels of oil per day would be needed. It can be concluded that the public transportation system in Illinois saves a considerable amount of our most scarce energy source, petroleum. Additional improvements and use of mass transportation could contribute significantly to the goal of energy independence by 1985.
To understand the industrial and residential-commercial statistics, one must look at the figures for the Gross State Product (GSP) for Illinois, shown in Table 2. These do not, of course, break down into sectors precisely corresponding to those given in Table 1. However, it is apparent that while manufacturing contributed almost $24 billion in 1973, the commercial activities represented in several of the other divisions contributed a higher figure. Comparing the U.S. Gross National Product (GNP) and the Illinois GSP reveals that commercial activities in Illinois represent a larger share statewide than in the nation. As a result, it is to be expected that commercial use of energy would be higher in Illinois than the national average. It is also reasonable to expect a higher residential use of energy since Illinois is colder than the nation as a whole.
The commercial-residential energy use figures for Illinois suggest that special attention should be given to space heating, lighting, and air conditioning if energy conservation measures are to have a significant impact in Illinois.
The figure for industrial use per capita in the state is lower than the national average. This is a surprising statistic since food, chemicals, metals, plastics, glass and paper—all high energy use activities—represent a large fraction of the industry in Illinois. If these figures are accurate (they are taken from the same source used by the Federal Energy Administration (FEA) Project Independence Study), they indicate that the industries of Illinois have been more energy-efficient than the majority of industries across the nation.
Fuel sources for Illinois
On a percentage basis, Illinois uses more coal and nuclear power and less oil and natural gas than the rest of the nation, as shown in Figure C. Even so, coal accounts for only approximately one-quarter of the energy produced in the state, as shown in Table 3. This is a
|
Table 3
Sources of Illinis energy for 1973 (estimates) |
|
|
|
|
BTU's (trillions) |
Percent of total |
|
|
|
Oil1 |
1394.5 |
36.9 |
|
|
|
Natural Gas2 |
1199.9 |
31.7 |
|
|
|
Coal3 |
964.9 |
25.5 |
|
|
|
Nuclear4 |
224.4 |
5.9 |
|
|
|
Totals |
3783.7 |
100.0 |
Sources:
1. Estimation based on data from:
a. Weekly Statistical Bulletin, American Petroleum Institute.
b. Mineral Industry Surveys—Sales of Fuel
Oil & Kerosine in 1973, Department of
Interior.
c. Office of Fuel & Energy Coordinator, State
of Illinois.
d. James Diehl, Department of Interior.
2. Mineral Industry Surveys—Natural Gas Production & Consumption: 1973, Department of Interior.
3. Federal Energy Administration.
4. Report of the Illinois Fuels & Energy Board, April 23. 1974
June 1975/Illinois Issues/169
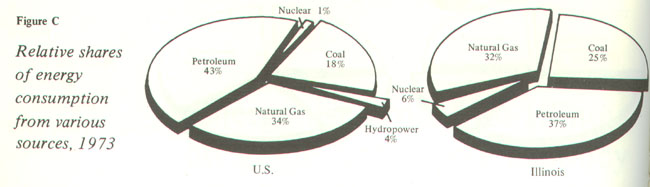
relatively low figure when the fact is considered that Illinois has 150 billion tons of coal. Illinois has the largest bituminous coal reserves in the nation. At the rate of energy used in 1973, Illinois coal could fuel the state for 1,000 years. Unfortunately, Illinois coal is the high sulfur variety and environmental restrictions have limited its use. However, the increasing cost of oil and natural gas plus the vulnerability of the United States to embargo by Arab oil nations has encouraged our nation to turn to coal as a major source of energy.
A number of techniques are available for removing the sulfur from coal. Most of these, however, require additional development. These techniques include "scrubbers," fluidized bed combustion processes, and coal gasification and liquefaction.
Debate over Illinois coal
The use of so-called "scrubbers" to
remove the noxious chemicals from the gases resulting from the combustion of coal is a highly controversial approach. The advantage of these devices, which are very expensive, is that they can be installed on existing power plants. But, most of the electrical utilities have questioned their effectiveness in removing sulfur. On the other side, the U.S. Environmental Protection Agency insists that scrubbers are effective. Agreement on both sides that scrubbers are performing effectively would mean that Illinois coal could be burned in existing power plants without harmful environmental effects.
Sulfur can also, in principle, be removed during the combustion process, and power plants of the future will undoubtedly use fluidized bed combustion processes that will do this.
Coal gasification and coal liquefaction are processes which use coal as a primary fuel to produce clean alternalive fuels, i.e., gasoline, heating fuel, etc. The undesirable chemicals, such as sulfur, are removed during the gasification or liquefaction process. One can expect to see coal gasification and coal liquefaction plants in Illinois during the 1980's. Such plants are not without drawbacks and attention must be paid to the environmental effects of such installations. For example, such plants have substantial water requirements (10 million gallons per day for a standard size plant), and special care must be taken to protect the water supply of the region. Finally, it must be pointed out that these conversion processes are only 60 to 70 per cent efficient (i.e., 30 to 40 per cent of the original energy content of the coal is lost in the process). Not-withstanding these drawbacks, coal gasification and liquefaction processes do provide a flexibility that our current energy system does not possess.
Looking ahead, it is possible to see Illinois coal providing energy to maintain an adequate supply of pipeline gas, gasoline, beating oil, and jet fuel for our state and for the region. Electric power will still be required in large quantities, and Illinois coal burned as "coal" in clean power plants of the future will provide a large portion of our electrical power production.
Role of nuclear energy
A review of energy sources in Illinois would be incomplete without special mention of the major role of nuclear energy in providing electrical power for the state. In 1974, over one-third of all the electrical power produced by Commonwealth Edison (which serves the Chicago and northern Illinois area) was generated in nuclear power plants. If adequate funding is forthcoming and if the citizens of Illinois remain convinced of the safety of nuclear power, we can expect to see an increasing share of electrical power produced by nuclear generating plants. Thus uranium and coal will provide the total electrical energy needs of Illinois, leaving natural gas and oil for other purposes.
More efficient use of energy
Although Illinois has a good record
in energy use, it is clear that higher prices, new legislation and increased citizen sensitivity will result in additional improvement in the efficient use of energy. Increased gasoline prices—especially if combined with improved mass transportation—will move many people out of their personal automobiles and onto subways and buses with a consequent decrease in gasoline consumption. Improvement in railroad services and increased use of rail, barge, and pipeline for freight transportation will also contribute greatly to an energy efficient transportation system.
Special attention should be given to the residential-commercial sector since it represents such a large share of the energy used in the state (Figure B). If energy is to be conserved, standards should be set for insulation, lighting, and ventilation for all new homes and commercial buildings. Incentives should be provided to encourage existing home and office owners to insulate their buildings properly. The use of heat pumps and solar heating and cooling systems should be encouraged wherever feasible, and federal or state assistance should be provided to accelerate these developments.
To save energy in the industrial sector, the use of steam and heat for industrial processes should be scrutinized carefully to eliminate unnecessary losses. Wherever possible, coal should replace oil or natural gas with the restriction that such substitution should not endanger public health. Appropriate siting of industrial parks and
170/Illinois Issues/June 1975
power generating plants would permit the use of waste heat for productive purposes.
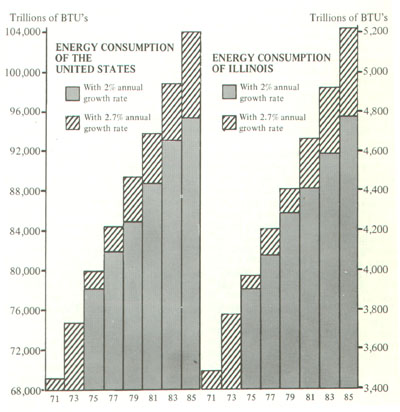
If these conservation measures are taken, the rate of increase of energy consumed in Illinois will fall from its current annual value of 4 to 5 per cent a year, to a value between 2 and 2.7 per cent a year as depicted in Figure D. The 2.7 per cent figure is the growth figure predicted for the United States by the FEA Project Independence Study if the cost of imported oil remains high. A 2.0 per cent energy growth rate is predicted if high oil prices are compensated for somewhat by a successful conservation program. Obviously, a lower price for imported oil would tend to drive this growth rate up. At the higher growth rate Illinois would be using 5200 trillion BTU's in 1985 compared to approximately 3800 trillion BTU's in 1973, whereas the 2 per cent energy growth rate would result in a requirement for 4800 trillion BTU's in 1985.
Energy and economy
The FEA Project Independence report predicts that the 2.7 per cent annual energy growth will give rise to a corresponding 3.2 per cent increase in the GNP. If this estimate is used for Illinois, the Gross State Product will reach a value of $74 billion in 1985, approximately one and one-half times as large as the 1973 figure.
There is no question that the current energy crisis will have a serious impact on all segments of Illinois society. However, our past performance in the utilization of energy, coupled with the tremendous natural resources of the late, particularly coal and water, give reason to believe that Illinois will be ble to effect additional economies in the use of energy. At the same time, the state's industrial and commercial productivity should increase without sacrificing the environment.ť
Figure D
Actual and projected energy consumption with different annual growth rates 1971-1985
Quatables
"It's like Alcoholics Anonymous. There's no way to cure a drunk unless he wants to be cured. And there's no way to control legislation until the membership or leadership wants to do it."
-House Speaker William A. Redmond (D., Bensenville) commenting on the introduction of 1,022 house bills on the last day for bill filing.
"In Illinois, the women have been good to their men."
-Mrs. Phyllis Schlafly, Alton, speaking before House Judiciary I Committee
in opposition to the Equal Rights Amendment (ERA). "That's the best argument for ratification. I have been good to my dog. But my wife is not a chattel."
-Rep. Ronald E. Griesheimer (R., Waukegan} in rejoinder.
June 1975/Illinois Issues/171