BY DOUGLAS KANE
A Democratic state representative of the 50th district (Montgomery and Sangamon counties), he holds the Ph.D. degree in public finance from the University of Illinois. The article is based on his doctoral dissertation.
State taxes and spending: Who gains, who loses?
THE ARGUMENT in Illinois over who pays state taxes and who receives the benefits from state expenditures is becoming more intense. The legislative debates in Springfield are at times heated. Downstaters protest they are always called on to bail Chicago out of its problems while Chicagoans proclaim that were it not for Chicago and the Chicago economy, downstate would dry up and blow away. In recent years the suburban legislators representing the communities which ring Chicago have made the discussions three-cornered. The debate became most strident during the 1973 fight over establishing a Regional Transportation Authority in the six-county Chicago area—a fight that was carried over into the actual operations of the authority.
At about the same time a young man by the name ofNeal Gamm proclaimed himself the governor of "Forgotonia" and raised the flag of independence in a 16-county, rural, relatively low-income area of Western Illinois. Gamm's theme was that the people of Forgotonia have "time and time again received the short end of the stick," and feel they get "little return on their tax dollars."
In 1973 the suburban legislators also carved for their constituents a much larger slice of the school-aid dollar by passing a new "resource equalizer" school aid formula that distributes state money on the basis of school tax rates and assessed property valuations. One of the reasons for the new formula was the desire to eliminate "discrimination" against dual districts in the old formula—a complaint voiced most loudly by legislators from suburban areas where most of the state's dual districts (separate elementary and high school districts) are located.
(For a fuller explanation of stale aid to public education see Merrill Redemer's article, "Slate added new 'resource equalizer' option to already complicated system of aid to schools," Illinois Issues, Feb.. 1975. pp. 47-50.)
What are the facts? When all of the state's taxes and spending are put together, who gains and who loses? Who pays and who receives?
Two things are clear: (1) in gross state tax payments the suburban part of the Chicago Standard Metropolitan Statistical Area (SMSA) pays the most; the City of Chicago and the rest of downstate pay less and receive more proportionately; (2) residents of the suburbs and Chicago pay a lower percentage of their income in state taxes (and in total state and local taxes) than do residents of other parts of the state. The long and the short of it is that the suburbs are richer than the rest of the state and subsidize it to some extent, even though the percentage of their income paid in state taxes is the same as Chicago's and somewhat lower than downstate's.
Depending on your point of view, different conclusions can be drawn from this situation. If it is agreed that everyone should pay the same percentage of income in state taxes, then taxes in the suburbs and the City of Chicago should go up, while taxes in the rest of the state should go down. If, on the other hand, it is agreed that no one section of the state should subsidize another, then taxes in the suburbs should go down and taxes in the City of Chicago and the rest of the state should go up.
When figures from the 1970 budget year are used and the state is divided into three major areas: (1) the City of Chicago, (2) suburban Cook, DuPage, Kane, Lake, McHenry and Will counties, and (3) the remaining 96 downstate counties, these facts emerge. The suburbs subsidized the rest of the state by $302 million; that is, they received $302 million less in state aid and services than they paid in taxes. Of that amount, $200 million went downstate and $102 million was spent in Chicago. On the other hand, residents of Chicago and the suburbs paid less than 6.5 per cent of their incomes in state taxes, while in 61 downstate counties the tax bite was more than 7.5 per cent of income, and in 38 of these downstate counties it was more than 8 per cent.
The City of Chicago is a net receiver of state funds only because such a large percentage of the slate's public aid recipients live in the city. If it were not for public aid, Chicago would have joined the suburbs in sending money downstate. In 1970 Chicago residents paid 28.5 percent of total state taxes. In return Chicago received 26.3 per cent of common school fund grants, 28.4 per cent of other school grants, 26.9 per cent of higher education grants, 28.2 per cent of miscellaneous grants and 32.5 per cent of income tax sharing grants.
Although the subsidies may seem large, they represent only a small part of the state budget. More than 92 per cent of all nonhighway state grant money in 1970 was returned to the county of origin. Less than 8 per cent of these funds crossed county lines with 31 counties subsidizing the remaining 71.
Of the $94.3 million that crossed county lines, $50 million was contributed by the three counties of DuPage, Lake and Will. Suburban Cook County in addition to contributing $14.9 million to downstate, contributed $128 million to the City of Chicago. Thus if suburban Cook County and Chicago are treated as separate entities; then state grant programs resulted in the redistribution of some $222 million, or 17.5 per cent of the total money involved.
Except for the money moving from suburban Cook County to the City of Chicago, the redistribution was typically from the northern half of the state to the southern, from high income counties to low income counties, from urban counties to rural counties. There are exceptions, however. The urban county of
June 1975/Illinois Issues/183
St. Clair gained a net $28.6 million, and such rural counties as Iroquois, Edgar, Livingston, Bureau, Stark and Marshall were net losers. St. Clair gained as much as it did because (1) tax contributions to the state are low (sales taxes on purchases made in St. Louis go to Missouri) and (2) high unemployment and low property values result in high welfare and school grants coming into the county.
Other downstate urban areas that were net gainers were Decatur and Champaign primarily because of heavy school aid grants. Rockford and Rock Island broke approximately even, while the other downstate urban areas were net contributors.
The rural counties that gave more in taxes than they received in general grant money were typically medium income counties that enjoy rich farm land and are below average in the percentage of property that is residential. This combination results in relatively low unemployment, and therefore low welfare grants, and high assessed property valuations per pupil, and therefore relatively low state school aid grants.
All but two of the 16 counties of "Forgotonia" were net receivers of money. In total, the area received $6.9 million more in general grants than it paid in taxes to support those grants.
In the area of highway taxes and expenditures 25 per cent of state highway money was redistributed across county lines. In 1970, the City of Chicago and the suburbs raised some $76 million more in highway taxes than they received in highway expenditures. This money was spent downstate. The "loss" represented a contribution of $10.12 by each of the 7.1 million persons living in the area to build highways in the rest of the state. The counties in deep southern Illinois received $36.23 per person more in highway expenditures than they paid in taxes, while the counties of "Forgotonia" gained a net $35.27 per person.
Table I divides the state into three major areas: the City of Chicago, the suburban part of the Chicago Standard Metropolitan Statistical Area and the 96 downstate counties, and shows the flow of monies in three categories, Downstate is a net recipient and the suburban area is a net donor in all three —state grants, highway expenditures, and general nongrant state expenditures. The City of Chicago is a recipient of grants and general expenditure, and a donor in highway expenditure.
184 /Illinois Issues/June 1975
TABLE I
Net flow of state monies and services among the three major areas of Illinois, 1970
|
|
|
|
General |
|||
state grants |
+$69 |
-$197 |
+$128 |
Highway taxes, |
|||
expenditure |
+ 76 |
- 32 |
- 44 |
General |
|||
|
nongrant state |
|
|
|
|
expenditures |
+ 55 |
-73 |
+18 |
|
Totals |
+$200 |
-$302 |
+$102 |
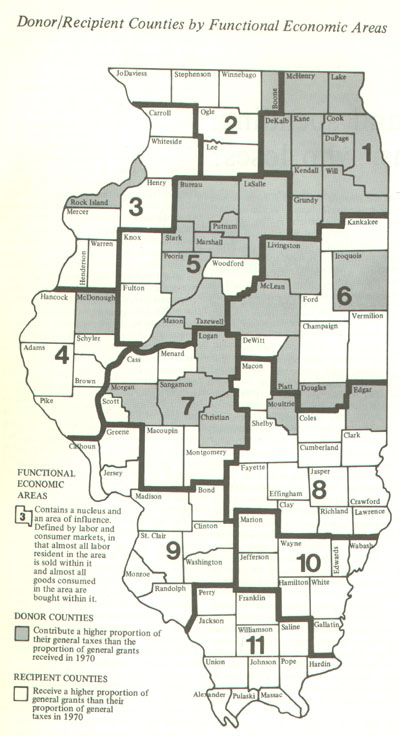
The general north to south, urban to rural, flow of money becomes clearer when the state is divided into functional economic areas (see accompanying map), and the net effect of general state grants and highway expenditures are totalled. Table II shows the flow of monies between the state's functional economic areas (FEA) but does not show the flow of monies between the suburbs and the City of Chicago.
As Table II indicates, the five regions with the lowest per capita incomes receive the highest per capita subsidies, while the reverse is true for the region with the highest per capita income (FEA #1).
Although the state budget has grown considerably since 1970, the only change that would significantly alter the direction in which tax money flows around the state is the new formula for state aid to education. In the two years since the new formula has been in use, state aid to education has increased by 35.2 per cent, or $275 million. Larger increases have gone to Chicago and the suburban areas, however, and smaller increases have gone to downstate schools, particularly downstate urban schools.
During that two-year period state aid to Chicago schools has increased 52.8 per cent; to suburban schools, 38.5 per cent; and to downstate schools, 22.9 per cent. Many of the schools in downstate urban counties have received less than 20 per cent increases. For example, LaSalle County schools received 15.2 per cent increases; Macon County, 19.1 per cent, McLean County, 2.4 per cent; Peoria County, 14.2 per cent; Sangamon County, 9.4 per cent; Tazewell, 15.6 per cent; Winnebago, 12.2 per cent; and Rock Island, 18 per cent. If this trend continues, Chicago will receive even larger subsidies, and the urban to rural transfer of money in the downstate area will increase.
In summary, the state tax structure is regressive. Lower income areas pay proportionately more in taxes than higher income areas. The state expenditure structure, however, is progressive. Lower income areas receive proportionately more in state aid and services than do more wealthy areas. Taken together, the state tax and expenditure Structure is slightly progressive in that poorer counties are generally net gainers and richer counties are losers. When local taxes are added in, the effect remains the same. But these transfers have not been large enough to keep residents of lower income areas from having to pay a higher percentage of their income in state and local taxes than residents of higher income areas.
TABLE II
Net gain or loss realized from state general and highway taxes, expenditures and I grants by functional economic area (FEA), 1970
|
|
|||||||||||
FEA |
Per capita |
Column 1 |
Column 2 |
Column 3 |
Column 4 |
Column 5 |
|||||
1. |
$3,628 |
- |
$76,291 |
- |
$10.74 |
- |
$71,041 |
- |
$10.00 |
- |
$20.74 |
|
2. |
3,048 |
+ |
4,181 |
+ |
9.87 |
+ |
1,321 |
+ |
3.12 |
+ |
12.99 |
|
3. |
2,928 |
+ |
7,549 |
+ |
21.60 |
+ |
2,733 |
+ |
7.83 |
+ |
29.43 |
|
4. |
2,343 |
+ |
7,500 |
+ |
45.72 |
+ |
2,011 |
+ |
12.26 |
+ |
57.98 |
|
5. |
3,125 |
+ |
19,836 |
+ |
31.14 |
- |
11,726 |
- |
18.41 |
+ |
12.73 |
|
6. |
2,775 |
- |
1,809 |
- |
-2.99 |
+ |
964 |
+ |
1.60 |
- |
1.39 |
|
7. |
2 932 |
+ |
6,846 |
+ |
18.46 |
+ |
1,150 |
+ |
3.09 |
+ |
21.55 |
|
8. |
2,599 |
+ |
10,600 |
+ |
27.81 |
+ |
10,148 |
+ |
27.34 |
+ |
55.15 |
|
9. |
2,523 |
+ |
10,269 |
+ |
15.02 |
+ |
37,308 |
+ |
54.54 |
+ |
69.56 |
|
10. |
2,211 |
+ |
2,480 |
+ |
17.62 |
+ |
7,165 |
+ |
50.81 |
+ |
68.43 |
|
11. |
2,182 |
+ |
8,824 |
+ |
34.61 |
- |
19,693 |
+ |
77.23 |
+111.84 |
|
The counties that bear the highest relative fiscal burden are medium income counties that are agricultural, enjoy rich farm land and are below average in the percentage of property that is residential. Regionally, this can be clearly seen in the net How of money out of FEA #6 in Table II.
The equalizing effect generated by the Hows of revenues and expenditures within Illinois are demonstrated by the following comparison. Alexander County, lying at the juncture of the Mississippi and Ohio rivers in deep Southern Illinois, had a per capita income of $1,775 in 1970 and an unemployment rate that continues to hover near 20 per cent. It generated only $222 per capita from state and local taxes during the same year. This took 12.8 per cent of personal income.
Suburban Cook County, however, with a 1970 per capita income of $4,284, generated $409 per capita in revenue from state and local taxes. This took only 9.5 per cent of personal income.
Through its programs the state transferred a net $133 in expenditures per capita to Alexander County, and subtracted a net $116 per person in taxes from residents of suburban Cook—leaving the final state-local expenditures in Alexander County at $356 per capita and in suburban Cook at $293 per capita.
It can be said that, following generally accepted principles of public finance, the flow of revenue and expenditures within Illinois is in the "right" direction, that is resources flow from high income areas to low income areas, from the suburbs to the inner city. The original disparities in income, tax effort and per capita expenditures are reduced by the fiscal activities of the state.
The final conclusions to be drawn are not obvious. There are enough facts to support just about any side of any question. One thing is clear, however. Financing of welfare, education and transportation—or any other program—should not be looked at in isolation. They are all part of a total state and local tax and expenditure system.
June1975/Illinois Issues/185