By PETER W. COLBY and PAUL MICHAEL GREEN They are professors of public service at Governors State University, Park Forest South, where they team-teach a course on U.S. and Illinois Elections.
Burgeoning Suburban power, shrinking Chicago clout:
Downstate holds the key to victoryTHE PURPOSE of this article is to analyze the distribution of potential voter support for the Democratic and Republican parties in the 1978 statewide elections. Since the 1930's, elections in Illinois have been analyzed in terms of Democratic Cook County versus Republican Downstate (the other 101 counties). Every election night, pundits have restated the number one political axiom in Illinois: the Democrats must build a large enough vote cushion in Cook County to overcome the deluge of Republican votes Downstate. There was a good deal of truth in this analysis, for it was only with the development of Chicago as a Democratic stronghold in the 1930's that the Democratic party became competitive in the state. As table 1 below reveals, the Republicans captured all 12 important statewide races during the 1920's. In the1930's, however, the Democrats were able to win all eleven statewide contests, including three in which the Republican candidate carried Downstate. Thereafter, a balance developed between the parties. In the 1940's, 1960's, and thus far in the 1970's, the Democrats and the Republicans have split election victories. Only in the 1950's were the Republicans able to achieve substantial successes, winning eight of ten elections.
Table 1
*Nonpresidential year Treasurer elections only The parity between the two parties statewide was achieved by a balancing of solidly Democratic Cook County against solidly Republican Downstate. From 1940 through 1977, the Democrats carried Cook County 32 of 43 times. Every time they lost Cook County, they lost the statewide race. Similarly, the Republicans carried Downstate in 38 of the 43 contests, and the five times they lost Downstate, they lost the election. Of even more interest are the 27 elections in which the Democratic candidate carried Cook County and the Republican candidate carried Downstate. Of those battles, the Republicans won 14, the Democrats won 13. This data is summarized in table 2 below.
Table 2
In short, analyzing elections in terms of Democratic Cook County versus Republican Downstate does generally describe politics in Illinois since the1940's. But this analysis is superficial and masks a number of important developments to which both parties must adjust if future statewide elections are to continue to be competitive. Otherwise, one party may again dominate the state as did the Republicans in the 1920's and the Democrats in the 1930's. What follows is an analysis of these underlying trends and their implications for statewide elections in Illinois.
Statewide elections now must be contested in terms of three areas:
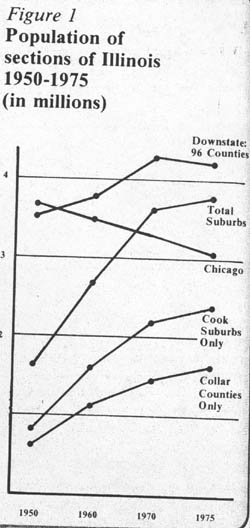
Chicago, Suburbs and Downstate Today, however, the situation is quite different. The total suburban population (including Cook County outside Chicago plus the Collar Counties) reached 3,857,000 in 1975, compared to 3,126,000 in Chicago and approximate-
7/ February 1978/ Illinois Issues ly 4,131,000 in the remaining 96 Downstate counties. In percentages, the Suburbs now represent 35 per cent of the state population, Chicago is 28 and Downstate is 37 per cent. The changing distribution of population in Illinois is depicted in figure 1 below.
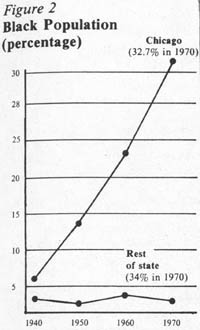
The nonwhite population of Chicago has been steadily growing while the nonwhite population of the rest of Illinois has not
The changing state population patterns are reflected in changing state vote totals* the Chicago vote is shrinking, the Suburban vote is rising, the Downstate vote remains constant A higher percentage of Chicago residents are voting Democratic than ever before, suburbanites have maintained a steady pro-Republican percentage, and Downstaters closely mirror the statewide outcome, giving only a slight edge to Republicans In any specific election, candidates, issues and other circumstances beside political party support help determine the outcome. These other factors may be becoming more important — if one looks at Illinois elections since 1900, there have been only five occasions in which the party winning the majority of statewide races did not either sweep or win all but one contest. Three of these occasions were 1968, 1972 and 1976. Thus, Table 5, below show a good number of ups and downs for each party in each of the state's three major voting regions. Nevertheless, it is possible to see a number of patterns in table 5. For example, Chicago has supported only one Republican presi-dential candidate in the last 12 election (Elsenhower in 1956) while the Suburbs have never backed a Democrat.
* Unless specified, all voting statistics used in this paper are from Presidential elections. The patterns of party voting in Presidential elections are likely to carry over to other races.
8 / February 19781 Illinois Issues
Table 6 is much more interesting because it shows the difference between the percentage a candidate obtained in a specific area and his percentage statewide. This tends to "cancel out" the statewide appeal of particular candidates or issues and reveal the political party preferences of the city, suburbs and downstate. There are strong and consistent patterns of party support revealed by this analysis. As table 6 demonstrates, the city of Chicago has become more different and more Democratic compared to the rest of Illinois over the past 40 years. During the same Period, the Suburbs have shown remarkable consistency in their support for Republicans, ranging from 10.3 to 13.3 per cent in 11 of the 12 elections. There are now more Democrats in the Suburbs than ever before, but there are also more Republicans. On a percentage basis, the Republicans have maintained their advantage. The Downstate vote is much more typical of the statewide totals as the small deviations indicate. This is not surprising, given the large and heterogeneous population which we have lumped into one category called "Downstate." Nonetheless, the 96 Downstate counties combined have had a slight pro-Republican leaning in every election since 1936 compared with statewide voting.
Democrats rely on Chicago for the vote; Republicans on the Suburbs
In the new balance of power, the Downstate vote is crucial Table 9 below shows the actual
margin of victory attained by Presidential candidates in the last 12 elections in Illinois. As with table 5 discussed earlier, table 9 contains great variations from election to election depending on the popularity of particular candidates. However, a close look at several of the elections reveals some interesting trends of party support. First, note the close Democratic election victories of 1940, 1944 and 1948. These elections conformed to the old Chicago versus Downstate pattern, and in each case, the Democratic victory margin in the city was sufficient to overcome Republican victory pluralities in the Suburbs and Downstate. Second, examine the vote totals in 1960. Like the 1940, 1944 and 1948 races, the Democratic victory margin in Chicago was sufficient to
February 1978 / Illinois Issues / 9 overcome Republican strength in the Suburbs and the rest of Illinois. But in each area, the margins of victory were larger than in any of the earlier elections, the net result being a very close Democratic victory. At the time, Kennedy's 1960 victory in Illinois was hailed as proof of the ability of Chicago Democrats to control state elections. We can see now, however, that 1960 was something of a "last hurrah." Changing population patterns were about to make it virtually impossible for Chicago to outvote the rest of the state. Thus, in 1968 and particularly in 1976, huge victory margins in Chicago were overwhelmed by even larger Republican victory margins in the Suburbs and Downstate, In 1976, the Suburban vote alone gave Ford a bigger margin than the city produced for Carter. It is interesting to compare the percentages attained by Truman in 1948, Kennedy in 1960 and Carter in 1976 with their vote margins:
Specifically, it should be noted that Carter did almost 4 per cent better than Kennedy in the city of Chicago, but his margin was 46,000 votes less. In the Suburbs, Kennedy did 4.5 per cent better than Truman, but lost by 62,000 more votes than did Truman. Carter scored 1.6 per cent better than Truman in the Suburbs, but in actual vote margins, he ran 233,000 votes behind Truman.
Table 10 parallels table 6 which was described previously. Table 10 was calculated by projecting how a candi date would have run in a particular area if that area voted exactly like the whole state. Then the difference between a candidate's actual showing and his projected showing was determined and that information is reported on table 10. For example, Carter in 1976 won 49 per cent of the statewide two party vote. If Chicago had given him only 49 per cent of its votes, he would have lost the city by 24,000. In fact. Carter carried the city by 425,000 votes, so Chicago deviated from the statewide pattern by 449,000 votes in favor of the Democratic candidate. Table 10 minimizes the impact of statewide candidate appeal and reveals the underlying support for one or the other political party.
Even a quick glance at table 10 discloses several crucial trends in Illinois elections. First, the city of Chicago has been favoring the Democratic candidate by about the same margin since 1960. This results from two opposing trends: the size of the Chicago vote has been declining, but the city's percentage of votes for the Democratic candidate has been increasing. These two opposite developments have coincidentally balanced each other, thus the absolute difference between the Chicago vote and the statewide vote has stayed about the same. Second, the Suburbs have become more Republican in terms of actual votes in every election since 1932. Again, this is the outcome of two other trends — the percentage difference between the Suburban vote and the statewide vote had remained remarkably constant, but the size of the Suburban vote has been increasing. The result of the steady Chicago vote deviation towards Democratic candidates and the increasing Suburban deviation towards Republican candidates is that Suburban Republicanism now effectively balances Chicago's base of support for the Democratic party. This means that the two parties now can be considered evenly matched in the six-county metropolitan area. The balance of power is Downstate, where the other 96 counties have regularly produced small deviations in favor of the Republicans. The importance of this data should not be underestimated. Despite the success of a few overwhelmingly poplar Democrats in the Suburbs in recent years (Alan Dixon carried the Suburbs in 1976, for example), the underlying base of party support for the Republicans is greater than ever, great enough to offset the Chicago base of party support for the Democrats. The Down state vote is more closely contested and is likely to hold the balance of power in close statewide elections.
New geography and the future of Illinois politics: The Democrats The crunch of the new geography rests with an awareness of population shifts and how they translate into vote margins. The disproportionate power of Chicago Democrats in a primary could alter the best population ratio fora winning state ticket. Thus, Chicago Democrats must show restraint and maturity in dealing with the number of Chicago spots on a statewide ticket. In addition, Illinois Democrats must push for unity between the three geographical areas of the state. It would only serve the Republican party to
10 / February 1978 / Illinois Issues have Chicago isolated from the rest of the state or the target of anti-city Democrats from Downstate or the Suburbs. On the other hand, Chicago Democratic leaders must finally admit that they do not have enough city troops to win any statewide elections on their own. Democratic leaders in Illinois must become election oriented and not allow past party feuds or slights make the party primary oriented. It is in Chicago and Cook County's interest to have a slate proportionate to the population. A Downstate-Suburban-led statewide ticket would have considerable appeal to Cook County suburban residents. Suburbanites in Cook County will probably cast close to 50 per cent of the county vote in 1978, and Republicans may be able to ride their country town pluralities to victory in future county contests. It is important to remember that because of the new Constitution, county sheriff, assessor, county board president and county commissioner races will be held at the same time as the statewide elections. Illinois Democrats must stress state unity. Unity means that Suburban and Downstate Democrats are now true political partners and will in fact lead most statewide tickets. Unity means that Illinois Democrats will no longer have anti-Chicago candidates or Chicago dominated slates chopping each other up in brutal primary campaigns. Gov. Dan Walker's 1976 primary loss and Michael J. Howlett's 1976 election defeat show the folly of either alternative. Unity means that Illinois Democrats will give the voters population-proportionate slates based on where the voters live or are moving, and not political-proportionate slates based on traditional strength inside the party. Finally, unity means no individual will have the ability to push personal considerations ahead of the overall welfare of the Illinois Democratic party.
New geography and the future of Illinois politics: The Republicans
Simply stated. Suburban and Downstate voters can outvote Chicago, and if political patterns remain unaltered that means Republican victories and Democratic defeats. It is not necessary for Republicans to improve their showing in Chicago — in 1976 James R. Thompson was beaten badly in the city while winning the biggest statewide victory in Illinois history. Gerald Ford received less than one-third of Chicago's vote, but still carried the state. As the data in this article has shown, the Chicago vote has become increasingly Democratic and increasingly different from the rest of the state. The Chicago vote has shrunk from almost half of the state vote in 1948 to about one-fourth in 1976. The population of Chicago is comprised of the same socioeconomic groups who support the Democratic party across the country, and they have become a larger portion of Chicago voters with every passing year. It is probably an insurmountable task for Republicans to improve their vote in Chicago in any substantial way. The few Republicans who have done well in Chicago have also run so well elsewhere that their showing in Chicago proves only that the city is not totally isolated from statewide appeal. Thus, the Republicans need only maintain their current areas of strength. Recently, the Democratic party has made some dents in the Republican Suburbs and usually Republican areas across northern and central Illinois. In 1974 particularly, the shadow of Watergate and Nixon's resignation produced surprising Democratic victories in legislative and congressional elections. However, 1978 elections promise a better environment for the Republican party. President Carter's popularity seems to drop month by month, and, historically, the party out of the White House usually does well in non-Presidential years. Moreover, in 1978, the Illinois Republican ticket will be led by three of the most popular vote-getters the party has ever had. If the Republicans balance the needs of their traditional Suburban and Downstate supporters, they will achieve a unified effort with excellent victory chances.
Conclusion
11/ February 1978/ Illinois Issues
|
||||||||||||||||||||||||||||||||||||||||||||||||||||||||||||||||||||||||||||||||||||||||||||||||||||||||||||||||||||||||||||||||||||||||||||||||||||||||||||||||||||||||||||||||||||||||||||||||||||||||||||||||||||||||||||||||||||||||||||||||||||||||||||||||||||||||||||||||||||||||||||||||||||||||||||||||||||||||||||||||||||||||||||||||||||||||||||||||||||||||||||||||||||||||||||||||||||||||||||||||||||||||||||||||||||||||||||||||||||||||||||||||||||||||||||||||||||||||||||||||||||||||||||||||||||||||||||||||||||||||||||||||||||||||||||||||||||||||||||||||||||||||||||||||||||||||||||||||||||||||||||||||||||||||||||||||||||||||||||||||||||||||||