|
Home | Search | Browse | About IPO | Staff | Links |
|
Home | Search | Browse | About IPO | Staff | Links |
|
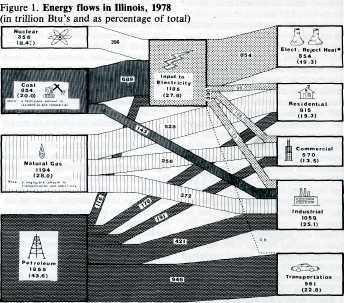
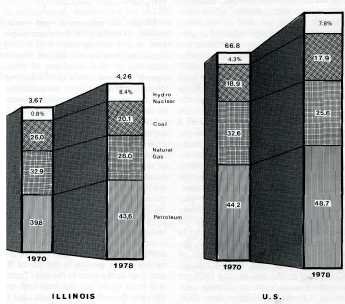
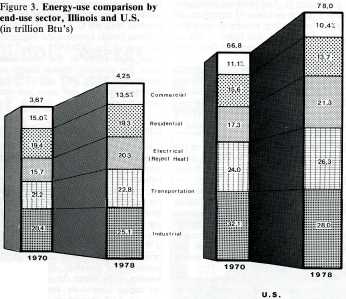
Editor's note: This is an update of the article, "Energy Use Profile of Illinois, " published in the June 1975 Illinois Issues. James P. Hartnett wrote that article in light of U.S. and Illinois energy consumption statistics up to 1973 and predicted that the rate of increase in energy consumption in Illinois would fall without causing a corresponding decline in productivity. SINCE 1973, a good many efforts have been made to reduce America's dependency on foreign sources of energy and to reduce our energy consumption generally. Passage of legislation requiring more energy-efficient automobiles, passage of the National Energy Act of 1978, and the phased deregulation of petroleum have all contributed to subtle shifts in energy consumption patterns. A major issue now being debated is the role government should play in these changes. Should *All of the energy consumption statistics in this article were derived from the State Energy Data Report published by the U.S. Department of Energy in April 1980. The Illinois economic data are based on the periodic publication, Illinois Gross State Product, published by the Department of Commerce and Community Affairs. government emphasize conservation to hold down the total energy demand, or should it emphasize energy supply and let the free market system achieve an equilibrium level of conservation? The new administration under President Ronald Reagan appears to favor emphasizing the supply side of energy, leaving the choices about conservation to the end users rather than making governmental policy about it. In spite of the technical and economic merits, such choices are not easily made and, as indicated by James Krohe Jr. in this magazine (August 1980), many issues on energy will remain inherently divisive. Energy flows in Illinois a trillion Btu is equivalent to the energy contained in about 170,000 barrels of oil or about 45,000 tons of coal. Total energy consumption in Illinois in 1978 was 4,216 trillion Btu. Petroleum-derived fuels accounted for 43.6 percent of this total, natural gas for 28.0 percent, coal for 20.0 percent and nuclear for 8.4 percent. During the same year, the state used about 1 percent (43.3 trillion Btu) of its total energy consumption to produce electricity for export. Equivalent consumption figures for the nation as a whole are: 48.7 percent petroleum, 25.6 percent natural gas, 17.9 percent coal, and 7.8 percent hydro and nuclear power (see figure 2). Furthermore, of this 7.8 percent, approximately half is nuclear, which brings out the fact that Illinois, with 8.4 percent nuclear, is more dependent on nuclear power than the nation as a whole. Illinois also differs from the nation in that very little natural gas is used for generating electricity, whereas in the nation as a whole 14 percent of the fuel used to generate electricity is natural gas. Similarly, Illinois electric utilities account for only 9.8 percent of Illinois' petroleum use in contrast to the national average of 16.2 percent. 14/May 1981/Illinois Issues The end-use sectors in Illinois also varied somewhat from the national picture for the year 1978 (see figure 3). The state's residential sector accounted for 19.3 percent of total energy consumption, contrasting with the national average of 13.7 percent. The higher level in the state is mostly attributable to Illinois' severe winter climate. The state's transportation sector used 22.8 percent of total energy compared to 26.3 percent in the U.S. Most of this difference can be explained by the fact that over half of Illinois' population is densely concentrated around Chicago which is well served by public transportation. The industrial sector in Illinois used 25.1 percent of the state's total energy, somewhat less than the national average of 28.0 percent. In short, the end uses of energy in the state are quite similar to those of the nation as a whole. The most notable differences are: 1) the more intensive use of energy by the Illinois residential sector and 2) the less intensive use of energy for transportation in Illinois. Changes and trends The relative shares of primary fuels going into the state's economy have changed over the last decade and can be compared with the national pattern (see figure 2). And there are analogous shifts in the end uses of energy in the major consuming sectors in both Illinois and the U.S. (see figure 3). Major trends of the state's energy flow from 1970 to 1978 are: • The relative share of coal used in Illinois decreased by about 5.9 percent during the decade. Since the overall energy use increased over the same period, the decrease actually amounts to a net 11 percent reduction in coal used in the state. • The share of nuclear energy in the state has dramatically increased, from less than 1 percent in 1970, to well over 8 percent of the total in 1978.
• Throughout the decade, the annual consumption of natural gas in Illinois has been remarkably steady at around 1,200 trillion Btu. Since the total demand has increased over this period, the relative share of natural gas dropped by about 4 percentage points during the decade. • The distributed electricity in the state increased at an annual growth rate of about 5.7 percent. However, after 1975 the demand for electricity dampened considerably and is currently between 2 and 3 percent. • The relative share of petroleum has increased in both Illinois and the U.S. over the last decade. However, Illinois is about 5 percentage points less dependent than the U.S. on this fuel. These trends compare the beginning and end of the 1970-1978 period, but there were shifts in the intervening years. For example, Illinois energy use increased in 1971, 1972 and 1973, but decreased the next two years and then increased again. Energy and economics May 1981/ Illinois Issues/15
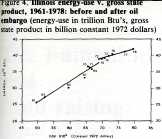
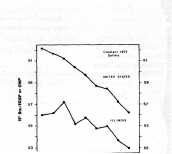
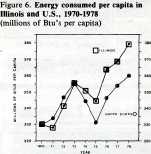
The relationship between energy use and gross state product (GSP) in Illinois for the years 1961 through 1978 is shown in figure 4. The sharply ascending lower line depicts the observed results from 1961 up to the oil embargo in 1973; the flatter upper line shows the relationship for the post-embargo period. The reduced slope of the ener-gy-GSP line after the oil embargo means that the energy required to generate a dollar's worth of product has decreased. In these terms, it took about 53,000 Btu to produce a dollar of GSP in Illinois in 1978 compared to a high of 57,200 Btu in 1972, an improvement of 8 percent (see figure 5). Over the same period, the trend in Btu per dollar for the nation has also improved by 8 percent, from a high of 62,000 Btu per dollar of GNP in 1970 to 57,000 Btu in 1978. Most of the change has been accomplished through greater attention to energy conservation and to improved products, such as small cars. Another way to assess energy performance is to correlate total energy use with population (see figure 6). On this basis, in 1978 the per capita use in Illinois was about 380 million Btu, approximately equivalent to 9 gallons of oil per day for each Illinois citizen. Compared to the nation, the 1978 per capita consumption in Illinois was about 5.0 percent higher than U.S. consumption which was about 360 million Btu per capita. Part of the reason for this difference may be extremes of climate compared to the nation as a whole. Illinois coal supplies In the longer range, the Illinois coal industry had high hopes for a major synthetic fuels industry, producing clean liquid and gaseous fuels from coal. The phased deregulation of natural gas, initiated in 1979, has resulted in increased natural gas production and has taken the pressure off synthetic gas production. On the other hand, we still have the national goal of reducing our dependence on imported oil. Thus, increased production of liquid fuels from all economically viable sources remains a high priority. In spite of this, the indications are that the Reagan administration will not encourage federal support of a synthetic liquid fuels industry. Thus, the prospects for the Illinois coal industry are not very bright. The coal industry has been the victim of a decade of uncertainty in government regulations in the environmental field and in government economic policy in the energy field. It is critical that some stability be established in these areas so that industrial energy planners can properly determine the most cost-effective directions for future investment. Continued federal indecision will not only jeopardize the eastern coal industry, but other energy industries as well. After coal, the only other conventional fuel in the state is petroleum. Illinois has been pumping crude oil at the rate of about 25 million barrels per year. Although this may appear to be a significant amount, it can only be considered modest since the state's annual consumption of petroleum is in excess of 350 million barrels per yer. The indigenous resources of other conventional fuels — natural gas and uranium — are nonexistent for all practical purposes. Solar and biomass 16/May 1981/Illinois Issues
these obstacles are overcome through legislative or economic incentives, solar may replace about 5 percent of current fossil fuel demand in the next two decades. Such incentives do not appear likely in the new political climate. One renewable resource in the state with significant potential is biomass (organic matter from plants and animals). For example, biomass may be used to produce alcohol, which can be used directly as a fuel or blended with gasoline to produce gasohol. Any indigenous substitute for liquid fuel reduces our oil imports, a national priority. Illinois is the nation's leading state in alcohol production, currently producing about 50 million gallons a year, that is, about 1.2 million barrels of alcohol per year, still a miniscule fraction of the total petroleum demand. Until recently, the future for alcohol fuels, and hence gasohol, looked promising since both federal and state governments offered sizable tax subsidies. Recent statements from the new administration suggest that federal subsidies are less likely in the future. In any case, the Reagan administration must give clear signals to the industry if rational planning is to be accomplished. A look into the future But one fact appears to be certain: the costs of energy will increase for all consumers in the future. The recent decontrol of oil has already increased the prices of gasoline and home-heating oil by about 15 cents per gallon. The price of natural gas is gradually increasing, due to phased deregulation. By all accounts, these trends will be accelerated in the foreseeable future. The real cost of electricity will also increase over the next decade. In the next five years, electric utilities in the state will be adding about 7,000 megawatts of new base-load power to their systems. The expected addition to the utilities' rate base will be on the order of $4 to $5 billion, and the effect of this increased rate base will translate into added cents per kilowatt hour for the consumer. From a consumer's point of view, higher prices for energy are, of course, not desirable, particularly for residential customers who cannot pass on the increased expenditures to anyone else. But on the other side, higher prices are the best motivation for improving efficiency and reducing demand. As seen in figures 4 and 5, it is indeed possible to reduce growth rates in demand, and still maintain a positive economic growth. On the energy supply side, the relative share of nuclear energy in the state will certainly increase over the next decade. An increase in demand for Illinois coal faces some uncertainties and, to some extent, depends on the federal government's decisions on the future of the synthetic fuel industry. Natural gas, which has maintained a fairly steady market in the past decade, is likely to continue to do so in the future. The hard questions are in the area of petroleum supply and demand. Although there may be good prospects for the discovery of more domestic oil, the transportation sector will continue to depend substantially on imports in the foreseeable future. As events in the recent past have shown, these imported petroleum supplies depend on the internal stability and policies of the exporting countries.
Trends in energy use Overall, one, can foresee that there will be further efforts at energy effi ciency and conservation in all sectors, primarily induced by increased costs. These efforts will slow the growth rate in demand for energy. But it is possible to maintain a healthy and growing economy while reducing the growth rate in energy demand. □ James P. Hartnett is professor of energy engineering and director of the Energy Resources Center, University of Illinois at Chicago Circle. He is also secretary of the Illinois Energy Resources Commission. P. V. Sudhindra is a research engineer at the center with a background in mechanical engineering. His current area of interest is energy conservation. The authors wish to acknowledge the help of Donald Bless who assisted in the acquisition of data and David Balderas who prepared the illustrations. May 1981/Illinois Issues/17 |
|
|