|
Home | Search | Browse | About IPO | Staff | Links |
|
Home | Search | Browse | About IPO | Staff | Links |
By PAUL L. SCHNIRRING Sophisticated computers and new methods of tabulation have made the 1980 census more detailed than any before. Yet, mounds of statistics are of little use without access and explanation. There are five state data centers, which will have all the data and can provide assistance. Here is a primer on how to use the 1980 census data. THE 1980 CENSUS, the single most exhaustive attempt to profile the United States, is over. The data from the decennial census are now being tabulated and put on computer tapes and microfiche and on paper. It will be 1983 before all the data are available. Meanwhile, the Census Bureau has already established a program of state data centers to improve public access to census information and to explain to the public how to use the data. Whether for state agencies or individual researchers, census data can yield information on anything from persons per room to acres per farm. In Illinois, the Illinois State Data Center Cooperative (ISDCC) has been established. Five data centers are open in Illinois to help Illinois citizens use census data in research, planning and administration. ISDCC, although new, uses resources already in place and people experienced with census data. The office of planning of the Illinois Bureau of the Budget, the contact point for the Census Bureau, is one of the centers. The other four state centers are at universities: Illinois State at Normal, Northern Illinois at DeKalb, Southern Illinois at Edwardsville and the University of Illinois at Chicago Circle. Each of the five data centers has similar resources, including maps, printed reports, microfiche and computer tapes. There are also 60 affiliate state data centers spread across the state specializing in local census data. These do not have the extensive information available at the five main centers, and their data are generally limited to printed reports. Affiliates range from the Southern Five Regional Planning Commission in Anna to the Chicago Public Library (a complete list is available from any of the five main centers, see ISDCC box on page 28).
The centers plan to hold group workshops and training sessions for those wishing to use the data. Typical topics covered will include data availability, project feasibility and time and cost estimates. The ISDCC foresees heavy use of census data by state agencies in their efforts to analyze policy issues and to plan, coordinate, implement and evaluate programs. For example, the state might be interested in the effects of a tax relief program, such as the circuit breaker. Using the 1980 census, it is possible to answer such questions as: How many elderly persons live in Illinois and where? How many own their own homes? What is the value and age of the residence? What are the real estate taxes on the residence? And how high are the costs associated with housing, fuels, insurance and mortgage payments? May 1981/Illinois Issues/23
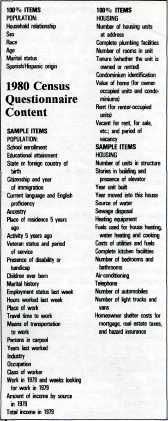
Energy consumption and costs have become a national issue. The 1980 census can provide the basic data for the types of fuel used to cook and to heat homes and water, the cost for household utility bills and fuel, and whether or not a home has air conditioning. The key to effective use of census information is to understand how data are collected and tabulated by the Census Bureau. When one is familiar with the items on the census questionnaire and the geographic areas for which they are tabulated, the potential uses of Census Bureau "products" become apparent. The 1980 census used both long and short questionnaires to gather data. The subject content of both forms was divided into two broad categories — population and housing. The short form consisted of 14 "100 percent" questions, so-called because they were asked of every household. Six were related to population and eight to housing. The long form contained the 14 "100 percent" questions, plus 41 "sample" questions. The long form sample questions are so named because they were distributed to only about 20 percent of U.S. households, or one in six in urban areas and one in two in rural. From the data gathered in both questionnaires, the Census Bureau will compile statistics to answer questions not found on either. These are called "derived items." For example, a measure of overcrowding, or persons per room, is not an actual item on the questionnaires. However, it can be derived by dividing the number of persons in the household by the number of rooms, both of which are questionnaire items. Some other examples of derived items are household size, mean income, mean education, gross rent and poverty status. In order to collect and tabulate data, the Census Bureau breaks down the nation into "geographic building blocks," or census geographies. There are two main types of census geographies: political areas and statistical areas.
Census geographies Statistical areas, delineated by the Census Bureau, are reasonably stable over time, and, therefore, may be used to analyze trends. Although they do not conform to political boundaries, data from small statistical areas can be aggregated to provide information for larger political areas. Nationwide, there are four census regions: North East, North Central, South and West. The North Central region, which contains Illinois, is further divided into the East North Central division and West North Central division. Illinois is in the East North Central division along with Indiana, Michigan, Ohio and Wisconsin. States within these regions are further subdivided into urban and rural areas. An urban population includes persons living in urbanized areas and any place else where 2,500 or more people reside. An "urbanized area" is defined as a densely settled area with a population of 50,000 or more, and includes a central city plus its closely settled fringe, regardless of political boundaries. A rural population is the balance of the state not in the urban population. States are also divided by ZIP code areas which is useful for market researchers, hospital administrators and others whose records are arranged by ZIP code. But for most data users, information by ZIP code area is impractical, statistically speaking, since the areas are not related to social, political or economic units. 24/May 1981 /'Illinois Issues
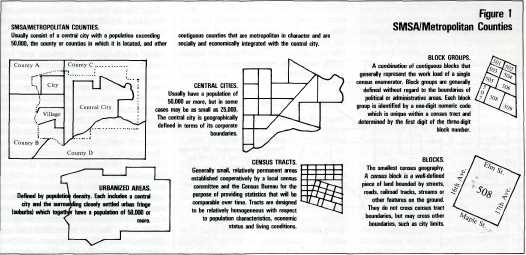
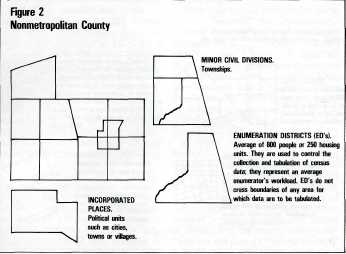
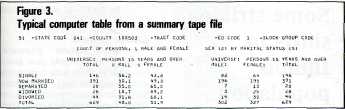
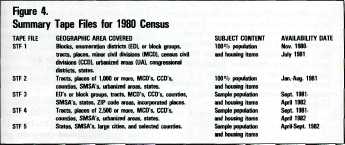
Counties are divided into smaller statistical units, which are somewhat different for metropolitan counties (those in SMSA's) than for nonmetropolitan counties. The major difference is that nonmetropolitan counties do not have urbanized areas. Generally, metropolitan counties contain tracts, block groups and blocks; they may have enumeration districts instead of block groups in the less densely settled areas (see figure 1). Nonmetropolitan counties are generally subdivided into incorporated places and enumeration districts; incorporated places of 10,000 or more, however, will be divided into tracts and blocks in 1980 (see figure 2). These census geographies can be added or subtracted (or both) to derive information on administrative or market areas not specifically included in the census. A park district, for example, is not a census geography. It may include one or more whole townships plus several census tracts, block groups and individual blocks. Once the census units within the district are defined, however, they can be pulled together to provide information on the park district as a whole. This building block approach can yield useful information on almost any geographic area or governmental district, whether or not defined in the census. Census maps are helpful to visualize geographic distributions and can be a key tool in using census data. A park district, school district or specialized area, for example, can only be correlated with census data by using a map. Census maps cover every inch of the nation, but are compiled by criteria which vary by geographic area. The five ISDCC data centers will have everything from the decennial census for Illinois (and some reports for contiguous states) to census maps and a host of specialized economic censuses including: retail trade, wholesale trade, services industries, construction industries, manufacturers, transportation, governments and agriculture. Most of the economic censuses are conducted in years ending in "2" and "7." The ISDCC collection also includes current business reports, current population reports and a host of other reports and reference materials. Microfiche, computer tapes Microfiche, like printed reports, will contain standard tables, but microfiche will have tables for small census geographies, down to townships or places of 2,500 population. For example, printed reports will generally contain standard tables for large geographies, such as how many men and women fall into various age categories in Illinois. That same information for a specific block group in a city, such as Decatur, is available on microfiche. Microfiche is relatively easy to use and offers almost immediate information retrieval at very low cost. But to retrieve information on even smaller census geographies, computer tapes must be used. There will be three categories of computer tables from the 1980 census: summary tape files (STF's), microdata files and software. The mass of statistics compiled from all the individual census questionnaires will be included in STF's. These tabulations of summary statistics will not include individual records or responses. In fact, if a summary statistic represents five or fewer households, it will generally be suppressed to ensure the confidentiality of the records. A typical STF table for a hypothetical block group is shown in figure 3. There will be five STF's produced from the 1980 census, each covering different geographic areas and question types. The ISDCC will obtain each of the tapes as they become available (see figure 4 for type of summary tapes and availability date). Microdata files, the second category of computer tapes, contain individual records with the geographic and individual identification removed. Public use microdata files from the 1980 census are compiled by selecting one out of every 100 census records and putting them on a separate tape. This is done only for large census geographies such as entire states, groups of counties and SMSA's larger than 250,000. (The Census Bureau is considering changing the 1980 microdata file parameters to areas of 100,000 or larger and changing from a 1 percent to a 5 percent sample.) Unlike STF's, microdata files can be "customized," that is, cross-tabulated to yield information suited to specific needs. For example, a company might want to market a new product to a target population consisting of those people in the Chicago SMSA who are self-employed, drive a car to work and were attending college five years ago. Although these characteristics are on the census questionnaire, they are not cross-tabulated in either printed reports or STF's. Using the Chicago SMSA microdata file, however, the company could profile the people sharing those characteristics, and, simply by multiplying by 100, come up with the size of their target population. It could then look at other similarities (or differences) in the target population, to create a much more detailed profile of the potential market. May 1981 /Illinois Issues/25 Microdata files and STF's contain only data. To access and use that data, the third category of computer tape, software, is necessary. The Census Bureau in 1980 created a software package, called CENSPAC, to give census data users easier access to data without the need for writing any special programming. For those without the resources or time for special programming, CENSPAC is especially valuable. Once a user defines the needed census geographies and notes what cross-tabulations or tables are wanted, CENSPAC will do the rest — compiling the information and producing the necessary tables. CENSPAC also works on most 1970 census tapes, so changes since 1970 could be observed. The Census Bureau publishes the Directory of Data Files, a catalog of available computer tapes. The tapes cost $110 per reel, but the ISDCC also is equipped to copy tapes in its collection on a cost-reimbursable basis. Contact one of the five state data centers for further information. The 1980 census will play an important role in the formulation of policy at all levels of government. It will also be valuable to business and industry and for independent research. But ultimately, the potential uses of the census will only be realized if it is widely understood and widely available. Although a year has passed since census day, April 1, 1980, ISDCC does have preliminary population and housing unit counts for Illinois, a set of 1980 census maps, and the reapportionment tapes (it details population by race for every census block in Illinois). Because of pending court cases, challenging census counts by large cities, such as Detroit and New York, the release schedule for other tapes could be delayed by six months. □ Paul L. Schnirring is program manager, Illinois State Data Center at the Illinois Bureau of the Budget. 26/May 1981/Illinois Issues |
|
|