|
Home | Search | Browse | About IPO | Staff | Links |
|
Home | Search | Browse | About IPO | Staff | Links |
|
By THOMAS J. ANTON The new federalism in Illinois With this article, Illinois Issues begins a new series on the "new federalism. " In this first article, Thomas J. Anton explains the origin of block grants in the "Great Society" of Lyndon B. Johnson, traces their growth in subsequent administrations and examines the further consolidation of categorical grants under Reagan. The central focus of his analysis, however, is the huge effect Reagan's programs will have on the state. Anton also provides a masterful overview of the federal fiscal system. In the second article (May), Anton will pinpoint federal outlays in Illinois by area, program and governmental unit and examine the likely effects of the tax cut on the state. Mike Lawrence of Lee Enterprises will complete the series with two articles evaluating the responses of state and local officials to the "new federalism." The series was conceived by Louis Ancel, Chicago lawyer and member of the magazine's Board, and is funded in part by a generous grant from the Ancel Charitable Trust. BEN FRANKLIN assured us long ago that only two things were certain in life: death and taxes. Had he lived to observe American politics and government during the past several decades, Franklin might well have been tempted to add a third category to his list of certainties — governmental reform. According to census reports, 155,116 governments of all types existed in the United States in 1942. By 1977 that total had been reduced to only 79,913, or a net reduction of 75, 203 governments in 35 years. More than 93,000 school districts and nearly 2,100 townships were eliminated during that period, while 17,663 special districts and 2,642 new municipalities were created. On the average, therefore, more than 3,300 governmental changes of some kind were made each year in the American states during this period. Among other things, this record of dynamic reformism makes clear that Americans love to tinker with government and do so with unusual and persistent enthusiasm. Tinkering with national government institutions is less frequent but, much more noticeable and noticed, largely because financial and media stakes are higher. Well-publicized commissions or study groups often provide vehicles for floating plans, while action is usually surrounded by considerable public ballyhoo designed to ensure that sufficient attention is paid to (and votes cast for) "the President's program" or "the Committee Report" or some equivalent. Since the 1950s there have been two main themes around which efforts to reform the national government have revolved: reducing the size of national government budgets and "returning" decisionmaking authority to the states. In the mid-1950s the Joint Federal-State Action Committee appointed by President Eisenhower worked diligently to recommend federal budget reductions by finding programs that could be transferred back to the states. A decade later President Nixon's transition team proposed a "New Federalism" built on a series of block grants for local and state governments. Now President Reagan has again proposed substantial federal expenditure reductions coupled with an even luore ambitious program of block grants for the states. The philosophies behind each of these major initiatives have not. changed much in four decades, but their influence has grown. None of the recommendations offered by Eisenhower's Joint Federal-State Action Committee were implemented, but Nixon's New Federalism produced several major new programs: General Revenue Sharing, Community Development Block Grants and Comprehensive Employment and Training Assistance. These programs did little to reduce federal spending, but they did consolidate separate programs into more manageable blocks, thus increasing the discretion available to local officials in spending federal dollars. President Reagan has been even more ambitious in pursuing these ideas. In less than a year he has achieved Congressional agreement on a $35 billion reduction in previously planned federal spending, the most significant federal tax reduction in our history, and the consolidations of some 57 separate programs into nine block grants. Given the size of President Reagan's budget reductions, to say nothing of their comprehensiveness, it seems fair to conclude that something more than "tinkering" is taking place. President Reagan's proposals may in fact constitute the most serious and most successful effort to reform the federal government since the 100 days of Franklin D. Roosevelt.
If the president is not just tinkering but changing the system, state and local governments are unavoidably involved. Although much political rhetoric has been lavished on the notion of clearly separate responsibilities for federal, state and local governments, the reality differs considerably from this image. Exceedingly few responsibilities reside exclusively at any one governmental level. Federal agencies are deeply involved in "local" functions such as schools, streets and police protection; state governments have a hand in shaping "national" tissues such as defense expenditures (and they constantly intervene in "local" affairs); local governments lobby hard for "national" policies such as revenue sharing and provide a constant supply of candidates for higher level office. These kinds of interactions have characterized American federalism from the beginning, but many observers believe that they have become more prevalent during the past two decades causing the system to become more "intergovernmentalized" than ever before. It is no longer possible, if it ever was, to imagine strictly separate spheres or planes of federal, state and locai activity. Clearly, any major change of direction or focus at one level is bound to have major repercussions at other levels as well. Changes as large and comprehensive as those proposed by President Reagan will undoubtedly create major pressures for change in state and local governments across the country. 6/March 1982/Illinois Issues Nowhere are these pressures likely to be felt more than in Illinois. With 6,620 governments of all types, Illinois is far and away the most "governed" state in the nation and is the perfect crucible for observing the consequences of national budget and program changes. these governments also vary enormously, from little-populated agricultural townships to the nation's third-largest metropolitan area, from hard-pressed cities to wealthy suburban enclaves. In short, Illinois provides an exceedingly rich environment in which to observe and assess the dynamics of modern American federalism. If the consequences of President Reagan's program are to be felt strongly anywhere, they will be felt strongly here; if appropriate responses to his program are to be devised anywhere, they will be devised in Illinois. In this paper, and one to follow, I propose to examine how this "new" new federalism will affect Illinois. I will examine some of the problems it poses for governments in Illinois, and discuss the coping strategies open to Illinois public officials. My analyses will make extensive use of a data system that has become available only recently, but which has unmatched capabilities for illuminating state, county and municipal participation in the federal system. The data, generally referred to as "federal outlays," have been collected for the past decade under the authorizing circular issued by the federal Office of Management and Budget (OMB). In this first article, I will use these data to sketch the major outlines of national budgetary growth during the 1970s, describe participation in that growth by Illinois and comparable states, and estimate the fiscal consequences for Illinois of proposed budget reductions as well as proposed changes in methods of distributing federal funds. The second article will attempt to show what will change by examining Illinois receipts from the 100 largest programs during the 1970s and estimated receipts under the Reagan program. I will also show where changes will occur by tracking federal program expenditures in each of the 102 counties in Illinois. Together, these analyses will permit me to identify the policy choices open to Illinois and to evaluate their feasibility. But first, some comment on the nature of the reforms currently being implemented is required. Reform or revolution? Appreciating the significance of President Reagan's proposals for reform requires some understanding of the system it will affect. Recent analysts have popularized the view that American federal relations have grown so large and complex that they can be only imperfectly understood by the lay public. This conclusion, it seems to me is unwarranted. American intergovernmental relations do have a well-defined structure, and that structure is quite comprehensible, primarily because it changes very slowly. Despite dramatic media reports of rapid and excessive change, American federalism exhibits, in fact, an impressive degree of system stability. For example, using federal budget outlays as an indicator, Charles L. Schultze, who was President Carter's chairman of the Council of Economic Advisors, has shown that federal spending as a proportion of Gross National Product (GNP) has not changed significantly for the past 30 years. A slight increase in this ratio occurred during the early to mid-1970s, but it was followed by a decrease (to roughly 20 percent) as the decade approached its end. Moreover, federal spending always has been highly concentrated in a few programs. The 15 largest programs typically account for half or more of all federal spending; the 50 largest programs account for 80 percent or more of total spending; and the 100 largest programs consume approximately 90 percent of total outlays. If federal grants to state and local governments are considered alone, the picture is very similar. Thus a review of OMB's 1979 Catalog of Federal Domestic Assistance reveals that "80 percent of federal grant expenditures are made by only 50 programs, and that the largest 100 programs account for some 95 percent of all grants-in-aid." Federal government spending has increased quite significantly, to be sure, but the structure of federal spending has changed very little, if at all. Examination of the jurisdictions within which federal spending occurs reveals a similarly impressive pattern of stability. As I have pointed out elsewhere,
March 1982/Illinois Issues/7
Concentration of federal grant expenditures in essentially the same states over time is reflected in relatively stable state shares of total federal spending. During the 1970s, for example, Illinois received an annual average of 4.33 percent of total federal outlays, receiving a somewhat lower percentage during the good years of the early seventies, and a somewhat higher percentage during the recession periods of the middle and late seventies. The range of high to low percentages, however, was quite narrow, from .25 percent below the mean on the low side to .21 percent above the mean on the high side. Year in and year out, however large or small aggregate national spending may be, Illinois and other states receive roughly the same share of total federal dollars expended. Thus whether we view federal outlays from the perspective of what is given in budget shares, or from the perspective of who gets what is given, federal government spending appears clearly structured, comprehensible, and stable across time. Viewed as a whole, the federal budget is more like a familiar glacier than an exploding volcano. These considerations imply that major changes in federal budget outcomes are likely to be quite rare and exceedingly difficult to achieve. We should not be surprised, therefore, to discover that the rhetoric surrounding President Reagan's reforms has been considerably more robust than the achievements themselves. To begin with, President Reagan has neither proposed nor achieved a budget cut. What he has proposed and achieved is a reduction in the rate of increase in federal outlays. Considering the tripling of budgetary outlays that occurred during the 1970s, this is no mean feat, but the crucial point is that federal spending will continue to increase in the aggregate under Reagan, as it did under Carter. Outlay increases under President Reagan will be drastically less than they would have been had Carter been reelected, if present assumptions about 1983 and 1984 remain valid (see table 1). But President Reagan has not yet proposed a reduction in outlays. That would amount to revolution, not change. President Reagan's package has three main thrusts: to cut federal taxes, to redistribute federal dollars from social services to defense programs, and to reshape the mechanisms through which federal spending takes place by replacing categorical programs with block grants to state governments. These changes are not new — ideas about American federalism change as slowly as intergovernmental patterns — but putting them together in a single package vastly increases their potential significance.
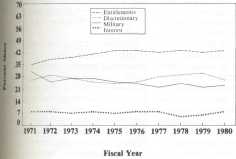
The major trends in federal outlay patterns during the 1970s depicted in figure 1 do not present a complete portrait, since they are based on only the 100 largest federal programs. Those programs, however, account for 88 percent of total federal outlays, and it is reasonable to assume that the trends depicted are accurate. It is apparent from figure 1 that the so-called "entitlement" programs, that is programs which define classes of individuals to whom federal support dollars must be delivered, became increasingly important during the 1970s, increasing their share of total outlays from 35 to 43 percent. Tying benefit payments in programs such as Social Security or Food Stamps to increases in the Consumer Price Index (called "indexing") clearly contributed to the growing significance of entitlement programs, as did economic recessions in 1974-75 and 1978-80, which increased the demand for Aid to Families with Dependent Children (AFDC) or Unemployment Compensation program benefits. As the entitlement share increased, the military share decreased, from close to 31 percent of total outlays in 1971 to 23 percent in 1980. Outlays for discretionary programs remained relatively stable, beginning and ending the decade at 26 percent of all outlays. It is important to recall, however, that many discretionary programs (Head Start education programs, for example) provide benefits to individuals or families who are also recipients of entitlement program benefits. Compared to these kinds of social assistance or service programs, therefore, military out-lays in the seventies became even less important than figure 1 suggests. The declining significance of military outlays as a proportion of total federal spending had been known for some time. Writing in 1976, for example, Charles Schultze pointed out that defense expenditures as a percent of GNP had been in decline for a quarter century and that a reversal of this trend was essential to national security. Schultze had been budget director under President Johnson and was soon to become President Carter's chairman of the Council of Economic Advisors. And President Carter began a systematic effort to increase defense outlays in both absolute and relative terms. Carter's last budget allocated 25 percent of total outlays to defense and included now-controversial items such as the MX missile, new tank production programs, and the addition of 80 new vessels to the Navy fleet. Against this background, President Reagan's decision to devote large additional increments to defense may be seen as an extension, not a redirection, of past trends. President Reagan's proposals differ from past trends in two very important respects, however, Schultze's analysis made clear that funds not expended for defense provided the resources necessary to support expanded social service programs in the 1960s and 1970s; maintaining those programs while increasing the budget share devoted to defense would therefore require an increase in federal revenue. In contrast, 8/March 1982/Illinois Issues President Reagan campaigned for and achieved a 25 percent decrease in federal income taxes over three years, the largest single tax cut in our history. more significantly, perhaps, President Reagan is not committed at all to maintaining existing goverment programs, particularly the social assistance programs developed since 1965. Even if he were, his tax cut would force him to cut somewhere — and cut large amounts somewhere — in order to find resources for increasing the budget share devoted to defense. Under the Reagan administration, therefore, drastic cuts in social service programs (the main sources of big money) are essential, not merely desirable. Resources not expended for social programs are now being used to support expanded defense expenditures. President Reagan has chosen guns over butter. The effects of this choice on federal spending for fiscal 1981 and 1982 are shown in table 2. In order to provide a realistic assessment of lost resources, these figures include the value of expenditures authorized by programs such as federal loan guarantees or mortgage guarantees. They are thus somewhat higher than estimates based on projected outlays alone. In addition, table 2 compares the most important functions in the federal budget in order to show the very different programmatic effects of President Reagan's proposals. Mr. Reagan's determination is clearly apparent in his elimination of $64 billion in spending authority from Mr. Carter's proposed 1982 budget, to say nothing of the $17.8 billion removed from fiscal 1981 authorizations. Programs designed to assist the needy and lumped together under the "income security" function suffered most, but education programs such as student loans and vocational education were also cut severely, as were myriad economic development and housing assistance programs grouped under the title of "commerce and housing credit." Resources generated by these reductions in projected future spending make possible the $28.2 billion increment in authorized defense expenditures as well as progress toward a "balanced" budget. Recipients of AFDC benefits, food stamps, low-income energy assistance and other "income security" assistance will clearly be fewer and poorer, but for the military services and defense suppliers, this program will provide a veritable bonanza. It represents a major redistribution of federal funds and federal budget shares. 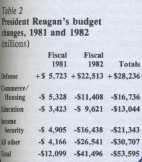
In addition to fund redistribution, President Reagan has made a major effort to expand the use of block grants as an instrument for delivering federal funds to state and local governments. Proliferation of new categorical grant programs during the heyday of President Johnson's "Great Society" led mayors and governors across the country to complain increasingly about the confusion and complexity created by that proliferation. The Johnson administration responded by initiating a search for improvement that led, in 1966, to the "Partnership for Health Act," the first of the recent series of major block grants. Later, just before he left office, President Johnson signed another major piece of block grant legislation, the "Safe Streets Act" that consolidated a number of federal crime prevention efforts under the new (and now defunct) Law Enforcement and Assistance Administration. Both of these early block grants had similar design characteristics: they consolidated several existing programs into a new block, they distributed newly consolidated funds to state governments, they authorized states to distribute federal dollars within state boundaries, and they required less reporting and accounting red tape as conditions for receipt of funds. They were also supported strongly by politicians from both major political parties. By the late 1960s, block grants had become the most prominent solution to the problems caused by an exploding grants system. President Nixon attempted to build on widespread support for block grants by proposing an ambitious program of "new federalism." Central to this program were seven new block grant proposals to consolidate and simplify federal grant allocations in major program areas such as education, transportation, urban renewal and manpower training. Unlike earlier reforms, however, Mr. Nixon's strategy opened the way to block grants delivered directly to local governments. Congressional and presidential politics ensnared Mr. Nixon's program, causing much of it to be abandoned, but he did achieve a new Community Development Block Grant that consolidated seven programs into one and delivered federal funds directly to local governments. His proposals for manpower revenue sharing became CETA, or Comprehensive Employment Training Assistance, which has provided block grants to local and state governments as well as other prime sponsors. Although not technically a block grant, General Revenue Sharing was a product of the Nixon presidency, providing essentially unconstrained funds to state and local governments for their use. Mr. Nixon's legacy was the creation of a more sophisticated federal grant system, with block grants to both state and local governments, and growing numbers of dollars channeled through these instruments. March 1982/Illinois Issues/9 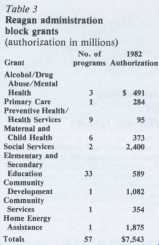
Greater sophistication unfortunately brought with it even more complexity, largely because categorical programs continued to multiply during the Ford and Carter presidencies. Grants "management" became a new watchword in Washington, leading President Carter to initiate a massive study, led by OMB, to develop proposals for streamlining the system. Against this background, President Reagan's proposals in 1981 appear to be something of a throwback to President Johnson's strategy of grants reform, since they focus on state governments as allocators of newly blocked federal programs. The Reagan program is different in two very important respects, however. First, Mr. Reagan's proposals have been far more comprehensive, originally encompassing more than 90 different federal programs. Like Mr. Nixon, President Reagan learned quickly that congressional participation can make a large difference: only 57 programs were finally approved for new block grants in 1981. Nonetheless, achieving those consolidations so quickly must be regarded as a major achievement. Second, Mr. Reagan has tied program consolidation to funding reduction in the blocked programs, arguing that the increased administrative efficiency to be achieved through block grants would more than make up the 20-25 percent reductions in program funding. Table 3 lists the nine block grants, the number of programs included within each and the funding level authorized for fiscal 1982 in the August reconciliation bill.
Although the data in table 3 would seem to imply that not much program consolidation was in fact achieved — four of the "blocks" include only one program, another has two and a third included just three — there is more consolidation than meets the eye. The Community Development Block Grant, for example, is accompanied by the elimination of Section 312 housing assistance, Section 701 planning assistance and Neighborhood Self-Help programs within the Department of Housing and Urban Development (HUD), and the Department of Energy's Weatherization and Community Economic Development programs. Similarly, the Community Services Block Grant is a replacement for the Community Services Administration, which has been abolished. There is also more funding reduction than these figures imply. The figures given in table 3 generally represent a 20-25 percent reduction from 1981 appropriations for the affected programs, but they are August 1981 numbers. In late September 1981 President Reagan proposed additional reductions in fiscal 1981 spending coupled with an additional 12 percent cut in 1982 requests. (The September 1981 budget figures will be presented in the subsequent article.) Applied to these block grants, the President's amended appropriation requests re-duced the Social Services Grant from $2.4 billion to $1,974 billion, the Com-munity Services grant from $354 to $225 million, the Alcohol and Drug Abuse Grant from $491 to $432 mil-lion, and so on. Since final appropria-tions for these and other programs are not made as of mid-December, total re-ductions cannot be clearly stated as yet. It is clear, however, that the Presi-dent intends to achieve even greater reductions in block grant spending than these figures suggest. The larger the reductions, of course, the less likely it will be that service reductions can be avoided through efficiency gains. Indeed, the idea that block grants are likely to reduce red tape seems less and less plausible. Congressmen have pet programs with clientele groups to service, as well as districts to represent; they are seldom willing to completely abandon control over benefit distri-butions to state governments that do not, after all, raise the money for federal programs. In approving Presi-dent Reagan's block grants, therefore, Congress made sure to include numer-ous provisions to constrain slate action — or, to use a more popular phrase, "red tape." In the Alcohol, Drug Abuse and Mental Health Block Grant, for example, states must com-mit fiscal 1982, 1983 and 1984 fund-ing to each community mental health center that received funding in l980 they must use 100 percent, 95 per-cent and 85 percent of the state allotment for 1982, 1983 and 1984 in the same proportion as federal funds for the blocked programs were used in the past; they must use at least 35 percent 10/March 1982/IUinois Issues of the state allotment for alcohol programs, at least 35 percent for drug abuse programs and at least 20 percent for preventive programs, and no more than 10 percent for block grant administration. In the Primary Care Block Grant, states are required to fund all applicant Community Health Centers in fiscal 1983 that were funded in 1982, and block grant funds can only be used to provide grants to Community Health Centers. In the Preventive Health Services Block Grant, states are required to continue funding emergency medical services, are required to allocate 75 percent of 1981 funds to hypertension programs in 1982, 70 percent in 1983, and 60 percent in 1984, and are prohibited against using funds for inpatient services, cash payments to intended recipients of health services, and so on. each of the block grants, in other words, contains enough constraining fine print to cause states to wonder how much "blocking" has actually been accomplished. In addition to the specific grant provisions, there are the Title XVII (of the August 1981 reconciliation bill) or crosscutting constraints that apply to all block grants. These generally require that states develop plans for grant use, that they apply for the grants, hold public hearings on plans and applications, conduct financial and performance audits every two years, follow the federal anti-discrimination guidelines, and permit access by the Government Accounting Office GAO) to all records and documents relevant to block grant expenditures by states and their subdivisions. The burden imposed on states by these kinds of requirements obviously will depend on how seriously they are enforced. In the past enforcement has varied considerably, and variable enforcement may well be the most likely pattern in the future. But state administrators reading the fine print of the block grant legislation certainly are entitled to wonder whether they really have gained more control in return for reduced funding, to paraphrase OMB Director David stockman, block grants may turn out to be no more than a trojan horse for additional budget cuts. President Reagan's program for expenditure reduction is therefore both less than it appears to be, yet more significant in many ways than either its supporters or critics have recognized. In one sense, most of the reductions are mere "smoke," since they cut anticipated future spending rather than current appropriation levels. Federal outlays will continue to increase, but at a slower rate. Furthermore, there are real questions about how much block grants will reduce federal red tape; the carte blanche given to the GAO may actually increase federal intervention, if not control. This is merely another way of pointing out that no program of this magnitude can be the product of the president alone. Congress is an active participant, with interests that are reflected clearly in the design of block grants. What is really significant about the president's program, therefore, is its comprehensive reshaping of federal spending priorities. The massive cuts in social service programs do reflect reductions from current spending levels; very large increments for defense do represent an increased budget share for military expenditures. Within the government the president has taken resources away from agencies and programs that provide benefits for low-to-moderate-income groups and redistributed those resources to the military. Outside the government the president's tax program has reduced the burden on the wealthy while increasing the relative burden on low- and middle-income groups. These actions reverse policy priorities followed by the national government for the past three decades. In this sense President Reagan's version of "New Federalism" is really new. If implemented as planned, the Reagan program would constitute a more radical change in the system than has occurred in a half century. Reaganomics in Illinois What effects will this new program have on Illinois and its people? Illinois is a large and wealthy state, ranking fifth in population (1980) and sixth in per capita personal income (1979); and its people are spread out over a large and varied land mass. Although wealthy compared to other states, the population includes large numbers of individuals who lack sufficient income to survive without governmental assistance. And while much of the state's land mass is sparsely settled, Chicago is the nation's second largest city and northeastern Illinois is the nation's third largest metropolitan area. Within this metropolitan area, differences between the City of Chicago and suburban governments are frequently as great or March 1982/Illinois Issues/11 greater than differences between northeastern Illinois and downstate. The dimensions of difference are not identical, but income, interest and culture distinguish the city's people from their suburban neighbors just as clearly as they mark the differences between downstate and the urbanized northeast. With 6,620 governments reflecting these differences, one conclusion, at least seems clear: President Reagan's reforms are likely to have very different effects on different areas of Illinois. 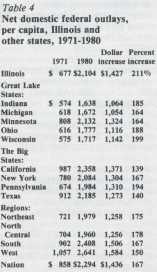
It is also clear that these effects will be substantial, if for no reason other than the magnitude of federal spending in the state. Federal outlays in Illinois exceeded $27 billion in 1980, up from $8.9 billion in 1971. This rate of increase, 203 percent, is substantially in excess of the national increase of 180 percent and exceeds the increments achieved by other Great Lakes states or the other large states by similar margins. When Defense Department procurements, payments on the national debt and foreign expenditures are removed to derive figures for "Net Domestic" outlays (see table 4), the differences between Illinois and comparable states remain roughly the same. When these calculations are expressed as per capita dollar amounts, an even larger rate of increase (211 percent) is revealed in Illinois than in comparable states during the 1970s (see table 4). On the other hand, federal domestic outlays of $2,104 per capita in Illinois in 1980 are substantially below the national per capita figure of $2,294, and well below per capita outlays in states such as California or Texas. Federal outlays in Illinois may be very large and increasing more rapidly than in other states, but they remain below average for the nation, and well below per capita levels in southern and western states. 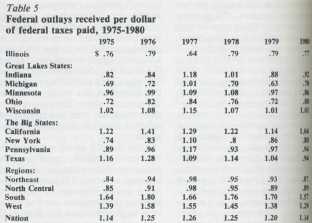
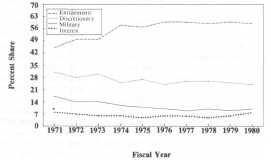
Below average returns from federal expenditures are important because, as a wealthy state, Illinois' contributions to federal tax revenues are well above average. Above average taxes and below average receipts produce a substantial and continuing disparity in Illinois between federal taxes paid and federal outlays received. The same is true for other Great Lakes states as well. The dimensions of this problem are suggested by the figures in table 5, which are derived by dividing net domestic outlays flowing into a state in a given year by net federal taxes paid from that state in that year. Between 1975 and 1980 Illinois received an annual average of slightly less than 76 cents for every federal tax dollar paid. Only Michigan among the Great Lakes states had a lower rate of return (74 cents), and all of the other large states did much better, particularly California, a state with higher per capita income than Illinois. Despite recent federal outlay increases, Illinois continues to provide very substantial subsidies to other parts of the country including states that are more wealthy than Illi-nois itself. Like other states in the northeast and north central regions, Illinois continues to contribute tax dollars that fund the needs of the South and the West. What kind of federal benefits flow into Illinois, compared to other states, and how can we explain such flows? It is important to emphasize that, in the American federal system, flows of funds from Washington are not necessarily initiated by Washington. Whether or not certain kinds of federal benefits flow into a state may depend on whether individuals and organizations demand such benefits. Which of the hundreds of federal benefit programs actually allocate funds to a given state would thus be a function of both the people and the organizational and political systems that create the channels through which funds are delivered. The size and variety of the Illinois popula-tion, coupled with the existence of so many governments seeking federal pro-gram dollars, suggest that Illinois should receive lots of dollars, divided among a great many programs. The $27 billion received in 1980 via some 900 different federal program accounts, is indeed lots of dollars. Rather than attempt to comprehend so many programs, I have again focused only upon the largest 100 programs, which account for more than 88 percent of all federal spending in Illinois during the 1970s. Figure 2 follows figure 1, above, in reporting trends in 12/March 1982/Illinois Issues outlays for entitlement programs, military spending, and discretionary programs. It is apparent that entitlement programs account for a much larger share of federal spending in Illinois, averaging some 59 percent of total outlays after the large increase took place in 1974. The other obvious difference between Illinois and the nation as a whole is that military spending is less than half as significant. Military outlays begin the decade at 17 percent of total spending but drop below 10 percent in 1977 and remain there through the end of the decade. Outlays from discretionary programs decline, but erratically, to just under one-quarter of total Illinois outlays in 1980. Compared to the nation, then, Illinois is a "soft dollar" state. Most of the federal funds it receives are derived from entitlement or discretionary programs that service either the retired or the needy; only a small share comes from military or other "hard" types of federal expenditures. Indeed, more than 84 percent of funds delivered to Illinois through the largest 100 programs in 1980 were classified as "soft" program dollars — the highest such percentage of any state in the nation. The relative insignificance of military spending in Illinois is a regional as well as state condition. Figures 3 and 4 track Defense Department spending (military procurements excluded) during the 1970s in other Great Lakes and large states, as well as Illinois. Measured in per capita dollars, all of the Great Lakes states stand far below the national average for defense outlays, and their position decays even further at the end of the decade. Michigan and Wisconsin are clearly even worse off than Illinois, Ohio and Indiana, but none of these states come within $100 of national per capita spending. As figure 4 demonstrates, Pennsylvania and New York are in a position similar to Illinois, and very different from California or Texas, both of which are nearly as far above the national average as Illinois, New York and Pennsylvania are below it. Obviously defense spending is regionally biased in favor of southern and western areas now and has been for some time. This bias is clearly a problem for Illinois, as it is for much of the northeastern and north central areas. 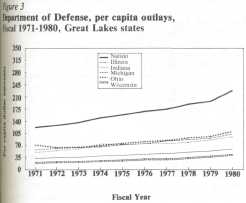
Uneven distributions of federal dollars imply disproportionate shares of program benefits. Since program dollars are distributed by agency officials, these shares should be reflected by different levels of significance for the agencies that distribute dollars. The agency shares of total outlays in Illinois in 1971 and 1980 for the major federal agencies are depicted in table 6. Although changes in shares are modest and rank orderings very similar, the magnitude of both shares and changes are of some interest. The Department of Health, Education and Welfare (now renamed Health and Human Services) increases its dominance across the decade, and funds from the Labor Department become slightly more important, presumably reflecting the increasing significance of welfare and employment training programs in the 1970s. Agriculture reduces its share but improves its rank, largely because both defense and HUD decline in relative significance. Since defense and HUD are dominated by "hard" expenditures, their declining significance — and the virtual absence of NASA outlays — help to account for the steady increase in the relative importance of "soft" or human service dollars in Illinois. 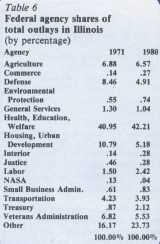
The dominance of "soft" outlay dollars in Illinois is critical, for it is precisely these dollars that are targeted for major reduction. Conversely, defense programs are the principal federal activities scheduled for large spending increments. In other words, very large reductions are being made in the programs from which Illinois receives its largest benefits, while very large increases are being made in programs that distribute very few outlay dollars in Illinois. For Illinois, the president's program is a double whammy. 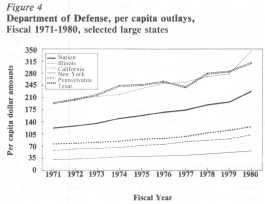
March 1982/Illinois Issues/13 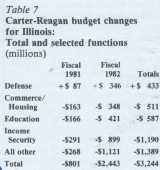
We can see the consequences of this dual blow by comparing the effects of the Carter and Reagan budget proposals (see table 7). These estimates are conservative, since they do not take account of still further reductions proposed in September 1981, and they also assume that shares of program dollars allocated to Illinois in the past will continue to be allocated to Illinois in the future — an assumption that may prove to be unfounded. Conservative or not, these figures suggest the magnitude of the problem now facing Illinois. Some $3.2 billion in federal outlays that would have flowed into the state had the Carter budget been enacted will be lost. This represents close to 12 percent of total 1980 outlays and, as the functional categories in table 7 make clear, these reductions will be concentrated in the programs classified under the income security and education programs of the federal budget. Defense spending will actually increase somewhat, but not nearly enough to offset the large reductions in programs such as education for the handicapped (-$101 million) or employment and training assistance (-$194 million), Medicaid (-$82 million), or even college library resources (-$15 million). In addition to large losses of "soft" dollars, however, Illinois faces substantial losses of "hard" outlays. Construction grants for wastewater treatment works will drop by some $282 million, federal highway assistance will fall by $340 million, rail service assistance will suffer a $43 million loss. Much of the loss in soft dollars represents a reduction in payments to individuals; most of the hard dollar loss, however, is a loss in revenue to state, county or city governmental units. An additional $134 million in state revenue will be lost in 1981 and 1982 because Illinois taxes automatically conform to federal tax laws; federal tax rate reductions therefore reduce state tax collections unless state action is taken to uncouple state from federal rates. In short, governments as well as individuals in Illinois will now be required to respond to federal funding reductions that are as comprehensive as they are large. If the new federalism means nothing else to Illinois, it will surely result in a new austerity for both individuals and governments. For Illinois the new austerity imposes a burden far greater than might have been expected. Table 8 compares the budget reduction share imposed on Illinois and other states with each state's average share of total federal outlays for the 1971-1980 decade. Illinois, whose average annual share of total federal spending during the 1970s was 4.33 percent, will absorb more than 6 percent of the reductions in federal spending imposed by President Reagan. Michigan, Ohio, Indiana and Pennsylvania will also suffer higher reductions than their state shares might have predicted. California, on the other hand, which received nearly 12 percent of all federal outlays each year during the 1970s, will bear only 5.3 percent of the total reductions imposed. Very different levels of defense spending are the main sources of this disparity, which again emphasize the very severe burden Illinois and its mid-western neighbors are being asked to assume. Conclusion The size and variety of the Illinois population guarantee that substantial federal dollars will continue to flow into the state. In the past those dollars have been especially important to the elderly and to various disadvantaged groups for whom money, social service assistance or housing were regarded as major components of need. President Reagan's program of New Federalism is "new" primarily because it seeks simultaneously to reduce taxes and redistribute federal funds toward expanded purchases of military hardware and related defense items. Reduction in program benefits and consolidation of some 57 social service programs into nine block grants are the main mechanisms used to reduce social spending. Although it is clear that the rate of federal spending for social programs will be reduced, it is less clear that red tape will be significantly reduced. If bureaucratic efficiency is not improved, Illinois will be confronted with sharply reduced federal outlays, but the reporting and auditing requirements that many Illinois governmrnt officials have repeatedly criticized will continue. Unless the needs of the elderly or disadvantaged wither away very quickly, or the stimulus promised by the federal-state tax reductions occurs even more quickly, the Reagan program promises to create serious problems for both the citizens and governments of Illinois. 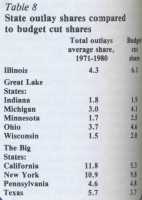
In my subsequent article, I will bring the Reagan program up to date by calculating what the most recent president tial proposals imply for Illinois. I will also examine where the pain will be felt by estimating changes in county level receipts of federal outlays. Finally, I plan to consider the possibility that the pain of expenditure reduction will be offset, at least to some degree, by the very substantial tax reductions already enacted. These several analyses will set the stage for a consideration of the issues raised by President Reagan's new version of an old federalism and the options available to local and state officials. If the problems are as large as the budget reductions imply, the time clearly has come for some innovative thinking. □ Thomas J. Anton is professor of political science at the Center for Political Studies, Institute for Social Research at the University of Michigan, Ann Arbor. His most recent book is Moving Money (1981); earlier works include The Politics of State Expenditures in Illinois (1966) 14/March 1982/Illinois Issues | ||||||||||||||||||||||||||||||||||||||||||||||||||||||||||||