|
Home | Search | Browse | About IPO | Staff | Links |
|
Home | Search | Browse | About IPO | Staff | Links |
|
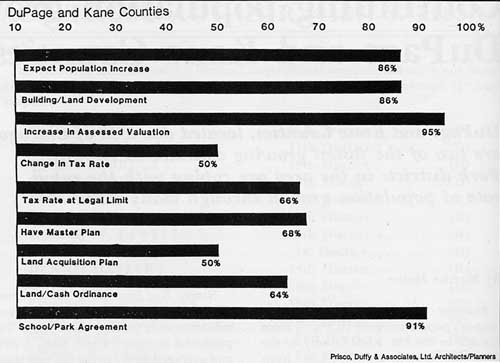
Continuing population growth challenges DuPage and Kane Counties, located due west of Chicago, are two of the fastest growing counties in Illinois. Park districts in the area are coping with the rapid rate of population growth through many means. By Martha Heine Between 1980 and 1987, DuPage County's population grew 10.8% — from 658,835 to 729,932. Kane County, in the same time period, grew 9.4% — from 278,405 to 304,621. Obviously this kind of growth rate in the population base requires clear foresight from Park District Board members. To meet the needs of the future, park and recreation professionals have to rely on accurate geographic and demographic information. Analytical surveys provide a way to access essential data for park and recreation planners and developers. Statistical facts learned from such surveys can substantiate efforts that provide for the expansion of recreation services to growing Illinois communities like DuPage and Kane Counties. Recently, Prisco, Duffy & Associates, Ltd., an architectural and land planning firm that designs park and recreation facilities, conducted a survey of over 20 Directors of Park and Recreation in these counties to determine how they are accommodating their district's population growth. The survey took almost two months to complete and included a wide variety of park districts. Expecting growth Eighty six percent of the directors surveyed expected their district's population to rise significantly in the next two years. Of those who contemplated an increase, 53% expected increases of 10% or more and 15% expected to have a population growth increase of 20% or more. Assessed valuation/tax rates Ninety five percent of the directors predicted an increase in their assessed valuation over the next two years. The predicted increase ranged from 3-18% and averaged 10% . In the last two years, 95% of the directors said there had been an increase of their assessed valuation of between 1-18%; the average estimated increase was 9%. Tax rates did not change in the same manner. Fifty percent of the districts had not changed their tax rate in the last two years. No director cited a dramatic change, (increase or decrease), in the district's tax rate. The actual tax rates ranged from $.32 to $.75. The average rate was $.44. According to the survey, 66% of the districts are currently at their legal, non-referendum tax rate limit. The median tax rate was $.42. Planning Sixty eight percent of the directors surveyed said that their district had a Master Plan (also called a Five Year or Comprehensive Plan). Of those with Master Plans, 56% wrote the plan in-house and 44% used a consultant. Of those who did not currently have a plan, 50% plan to write one, either in-house or by using a consultant. Directors cited several objectives for master planning. Land acquisition, capital improvement, demographic studies and financial plans were some of the subjects covered within the plans. Fifty percent of the directors said their districts have a land acquisition plan (not necessarily included in the Master Plan). Many target areas or types of land they would like to develop. Some, such as the Fox Valley Park District, have targeted riverfront property. Others are working to acquire flood plain, neighborhood parks or other land. Master Plans may contain any of the above information and more, depending upon the needs of the park district. Each district with a Master Plan created a plan that served its unique needs. Some districts update their plan every year, while others update only when they feel it is needed, if at all. Buildings/land development To meet with the high population growth rate and to upgrade current facilities, 86% of the directors surveyed said that their districts were planning new buildings or large land developments. Of those, 32% were planning (or were currently building) new large full-service community/leisure centers, 21% were planning a park facility, 10% new pools, 10% new park districts offices and 26% were building other various facilities. Most districts fund new buildings and large land development through grants and bonds, but a few use other methods of funding as well. As an example, in Elmhurst, Illinois, director Michael Pope says the district is developing a "corporate partner" program with Elmhurst Memorial Hospital to partially fund a planned $3.8 million community center. "Hospital clients will use the center for prescriptive visits," he says, "and in exchange, the hospital will pay capitol costs Illinois Parks and Recreation 19 September/October 1988 to renovate part of the building and pay a yearly agreed upon sum." Health education classes will also be held at the new facility once it is complete. Land acquisition Sixty four percent of the districts surveyed were in communities that operate under a land/cash ordinance. Fifty seven percent of those with land/cash ordinances use the ratio of 5.5 acres per 1,000 people or the cash equivalent. Districts in eastern DuPage find acquiring land difficult. Many are land locked, having already acquired most of the land available to them. The districts surveyed owned between 26 and 1,600 acres of land. In proportion with the population, the park districts operated between 2.6 and 18.6 acres per 1,000 people. The average acreage per 1,000 people was 9.47 acres; the median was 9.7 acres per 1,000 people. School/park agreements Ninety one percent of the districts have a school/park agreement. Sixty three percent of those have agreements with more than one school district. The school/park agreements vary, but 32% of those with a school/park agreement use a "services exchange" system — most often relying on the park district to supervise maintenance of school grounds in exchange for use of the buildings. Sixty seven percent of the districts have no formal policy with the school districts for building new facilities. However, many districts stressed they do consult with their local school district and vice-versa before new facilities are built or land is developed. David Thomas, director of the West Chicago Park District, stressed the importance of a good working relationship between all taxing bodies. "In West Chicago we have what we call a Municipal Managers' meeting", he said. The chief executives from the city of West Chicago, the park district, the two school districts, the fire protection agency, the library and the DuPage County Airport Authority meet once a month for coffee and donuts to discuss matters of mutual interest. "We talk a lot about planning," Thomas said, "especially with the DuPage County Airport Authority." Survey of Park and Recreation Directors
These meetings have helped create a community wide cooperative that Mr. Thomas believes has saved West Chicago's tax payers a lot of money. It has also helped solidify a healthy school/park relationship; West Chicago school and park districts share in the operation and the revenues raised from the use of the community swimming pool. Demographics As most districts continue to observe their counties increasing in population, they are interested to know what types of people are moving into their area. What are the needs, concerns and interests of these incoming people? What will be their impact on the community? In Bloomingdale, Illinois, several new developments are underway that will eventually attract large numbers of new people to their area. Bloomingdale's park district is watching with interest who is moving in. Supervisor of Recreation, Marijo Bailey, foresees that there will be many young couples and "empty-nesters" moving into the multi-family housing under construction in her district. The Bloomingdale Park District must strive to meet the needs of the new population, one that differs from a population where more children are present. Summary In summary, the overall trend found in this survey of DuPage and Kane County park districts was growth! Because their park district boards have been keeping an eye to the future, DuPage and Kane Counties will continue to grow into the 21st century and their park districts will grow with them. The contributing park districts surveyed were as diverse as the populations they serve. Demographics, land available, age of the community, tax rates, facilities and planning were unique to each district. Flexible agreements with school districts, and corporate partners in the community have assisted in developing new and innovative programs that improved the park districts' abilities to serve incoming population groups more effectively. Meeting with chief executives of local community groups and services have provided new avenues of communication that facilitated adapting to change. Overall, dealing with change positively has become an interesting and rewarding opportunity to learn more about the communities they live in and the trends of change that continue to effect them. ABOUT THE AUTHOR: Martha Heine is the Marketing Coordinator for Prisco, Duffy & Associates, Ltd. of Naperville and Aurora, Illinois. The architectural firm is currently designing recreation centers for the Geneva and Mt. Prospect, Illinois Park Districts. Illinois Parks and Recreation 20 September/October 1988 |
|
|