|
Home | Search | Browse | About IPO | Staff | Links |
|
Home | Search | Browse | About IPO | Staff | Links |
|
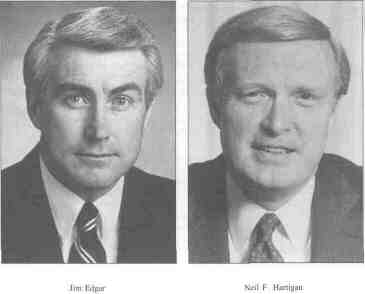
By PAUL M. GREEN
Vote analysis of Edgar victory:
Sixteenth century Italian political philosopher Niccolo Machiavelli advised his prince, "It would be best to be both loved and feared, but when necessity forces a choice, it is better to be feared .... Friends may fail you, but the dread of punishment will never forsake you." Four centuries later, Anton Cermak, Chicago mayor and Democratic party machine builder, provided the corollary: "Power came not from the ability to reward but to punish." In 1990, Democratic gubernatorial candidate Neil F. Hartigan was victimized by his hometown of Chicago and its once vaunted Democratic political organization. Gone are the days of Chicago machine politics with expectations of punishment or rewards to be meted out ward by ward, precinct by precinct, according to a boss's scorecard of Democratic vote tallies. There is no prince. Instead, because of impotence or indifference, Democratic politicians of all colors and in all parts of the city either cut separate political deals or do not respond to pleas to deliver votes. The once powerful post of Chicago Democratic ward committeeman is a political anachronism; Chicago's voters are showing more independence; at the same time there is racial February 1991/Illinois Issues/15 divisiveness and political apathy in the city. Republican Jim Edgar defeated Hartigan for the governorship because Chicagoans did not turn out to vote. Unlike the other regions of Illinois, Chicago alone had less gubernatorial voters in 1990 than in 1986. In the end, Hartigan relied on a Chicago Democratic party that has become a "paper donkey" in all but a few of the city's 50 wards. The great unanswerable question is: Was Hartigan's inability to attract a higher percentage of support from those Chicagoans who did vote a result of their personal rejection of him or was it because of their acceptance of Republican Edgar? Compared to the 1986 gubernatorial election between James R. Thompson and Adiai E. Stevenson III, Hartigan won higher percentages than Stevenson in several parts of the city, but these percentage improvements were offset by a dramatic drop in voter turnout, especially among the bedrock Democratic voters in African-American wards. One issue dominated this campaign statewide: taxes. Hartigan took a very strong antitax position. He advocated (1) allowing the temporary two-year income tax surcharge to expire on June 30, 1991, (2) "cutting" 2 percent, or $573 million, from the state budget and (3) allocating 25 percent of new state revenue to education his first year and 50 percent thereafter to make up for the $383 million annual loss to education by discontinuing the surcharge. Edgar supported continuation of the income tax surcharge, and he was as firm in advocating state control over rising local property taxes by placing a cap on them equal to either the annual cost of living or 5 percent, whichever was less. Edgar rejected Hartigan's projections for new state revenue as a hollow promise to education because the current economic slowdown and a possible recession would strangle state revenue growth. Campaign strategies of both Edgar and Hartigan centered, in a sense, on the well-worn pejorative political phrase "flip- Table 1. Comparison of Illinois elections, 1990 and 1986 gubernatorial and 1988 presidential vote, by regions
16/February 1991/Illinois Issues flop." Hartigan, the lifelong Democrat, was known for his roots in Chicago politics and his espousal of liberal social causes, but in the 1990 campaign he took a hard-line conservative stance that was clearly in the mold of such national GOP antitaxers as Jack Kemp or Pete DuPont. Edgar, the lifelong Republican, was known for his strong attachments to the rural and downstate conservative roots of his party, but in the 1990 campaign he became the darling of most of the teacher and public employee unions due to his all-out support and defense of a continued higher rate for the state income tax to support education. Each man wanted to disrupt the philosophical and political base of the other. When the punch card dust had settled, it was Edgar who outdid Hartigan. This strategy helps explain the split-ticket voting in all parts of Chicago with voters punching Edgar among their otherwise Democratic choices. Hartigan's loss paralleled Michael S. Dukakis' 1988 presidential campaign defeat by George Bush in Illinois. (See table 1.) Percentage-wise, Hartigan ran behind Dukakis in Chicago, ran exactly even in the Cook County suburbs and ahead of him in the rest of the state. In the end, both barely lost statewide: Dukakis lost by 94,999 votes, Hartigan by 83,909. Comparing the last two gubernatorial battles is somewhat confusing since in 1986 Democrat Stevenson was forced to create a new party (Solidarity) after a Lyndon H. LaRouche Jr. disciple won the Democratic primary nomination for lieutenant governor. There was a Democratic ticket in 1986, but since the governor and lieutenant governor candidates must run as a team in the Illinois general election, Stevenson withdrew to run as a Solidarity party candidate, leaving the Democratic gubernatorial slot vacant. Democratic gubernatorial votes were cast, however, and adding those to Stevenson's allows comparison to Hartigan in 1990. The geopolitical reality of Edgar's victory becomes clear by comparing the Republican and Democratic gubernatorial vote in 1990 to the 1986 governor vote (including Solidarity in the Democratic total). Edgar's percentage of the Chicago vote was slightly better than Thompson's in 1986 (though Edgar's city support came from different areas). In the other regions, Edgar ran behind Thompson's 1986 percentages. Thompson's winning margin against the combined entry (Democratic votes added to Stevenson's total) was 190,379. Hartigan cut 106,470 votes from that Thompson winning margin, but it was not enough to beat Edgar. Hartigan suffered from a Chicago turnout disaster. (See tables 2 and 3.) Illinois breaks down into four geopolitical regions: (1) Chicago, (2) the rest of Cook County, (3) the five counties surrounding Cook as its collar — DuPage, Kane, Lake, McHenry and Will and (4) the other 96 counties downstate. Of the four regions, only Chicago had fewer people voting in 1990 than in 1986. Chicago's falloff reduced the city's share of the total statewide gubernatorial vote, dropping it to 21 percent, or 4 percent less than in 1986. If Chicago had even matched suburban Cook County's increase in voter turnout from 1986 to 1990, the Edgar-Hartigan race could have been a dead heat. Instead, Chicago's vote dropped nearly 100,000 and with it Hartigan's chance for victory. (See table 2.)
The big story in Chicago was the drastically reduced vote margins Hartigan received in the African-American wards. In 1986 (despite the presence of a third party Democratic alternative, which siphoned off over 2,000 votes in almost every black ward), Stevenson had eight wards (all black) that gave him higher winning vote margins than Hartigan's best ward in 1990. For example, in 1986 then-Aid. Eugene Sawyer's southside middle-class black 6th Ward gave Stevenson a margin of 16,102 votes; in 1990 Hartigan won the same ward by only 9,337 votes. In 1986 all of Stevenson's top 10 margin wards were black. In 1990 Hartigan's top 10 were Chicago's falloff reduced the city's share of the total statewide gubernatorial vote, dropping it to 21 percent. . . eight black and two southwest side white wards — the 11th (Daley family) and 13th (House Speaker Michael J. Madigan). Some have argued Mayor Richard M. Daley could have done more for his old comrade Hartigan, who began his political career under the mayor's father, Richard J. Daley. In sheer numbers, the Daley ward did do its best, giving Hartigan an 8,903-vote margin compared to a 5,168 plurality it gave Stevenson in 1986. Elsewhere in the city Hartigan won back most of the northwest and southwest side wards won by Thompson in 1986, but Hartigan's gains were quashed in the city by its lower voter turnout and diminished black support. Comparing Hartigan votes in the city to other 1990 Democratic candidates shows that U.S. Sen. Paul Simon and many running for Cook County offices racked up significantly higher ward totals than Hartigan. Hartigan benefited not at all from coattails at the top or bottom of the ticket, suggesting either a deficiency in his campaign or a robustness in Edgar's. On the latter, one old-time Democratic pol commented on how badly the Republicans wanted to retain the Executive Mansion: "They put a s — t load of dollars on the street." February 1991/Illinois Issues/17
In GOP-dominated suburban Cook County, Edgar ran like a Republican thoroughbred, winning 27 of the 30 townships. Like most GOP candidates, Edgar found the political track most comfortable in northwestern Cook County, where he racked up his best margins. Compared to Thompson in 1986, Edgar won one less township. Of special interest in 1990 was Hartigan's significant cut (9,000 votes) into Edgar's winning margin in southwestern Worth Township, which was countered by his big loss of votes to Edgar in liberal-minded townships such as Evanston and New Trier. Clearly, organization Republicans in the collars . . . went all out for Edgar despite strong philosophical differences with him on taxes and abortion Percentage-wise in suburban Cook, Hartigan kept Edgar to an 18-point winning margin, 10 points less than Thompson's in 1986. Edgar won two townships (Barrington and Palatine) with 70-plus percent of the vote, while Thompson had nine such victories in 1986. Moreover, Hartigan came within an eyelash of winning such diverse townships as Bremen and Thornton in southern Cook County, Berwyn to the west and Niles to the north. Hartigan's antitax message clearly helped him and hurt him in suburban Cook County. In the Republican collar counties, over 80,000 more people voted for governor in 1990 than in 1986. While Hartigan cut into Republican numbers from 1986, Edgar gained in the collars because more voters turned out. Their larger share of the statewide total enhanced their votes for Edgar, even though his suburban percentage trailed Thompson's in 1986. In Will County, for example, Hartigan chopped off more than 13,000 votes from Thompson's 1986 margin and finished 10 points ahead of Stevenson's 1990 share of the vote (from 36 percent to 46 percent). To a lesser degree the story was the same in the other four collar counties. Clearly, organization Republicans in the collars — the new bedrock of GOP vote power in Illinois — went all out for Edgar despite strong philosophical differences with him on taxes and on abortion. These are generally conservative Republicans but they voted party over philosophy as they heeded their leaders and Edgar's calls for party unity to avoid a Democratic takeover of state government. The General Assembly has been controlled by the Democrats since the last redistricting, and for Republicans to have any sway in 1991 redistricting, they had to hold onto the governorship. A key ingredient to Edgar's winning margins in the collars was the willingness of conservative Republicans to close ranks behind Edgar after supporting right winger Steve Baer in the GOP primary for the gubernatotial nomination. Downstate was where the Hartigan campaign was best organized and most effective, especially south Springfield. In 1986 Stevenson won eight of the 96 downstate counties; in 1990 Hartigan won 42. Unlike Stevenson's eight feeble downstate victories, Hartigan won with major margins. St. Clair and Madison counties shifted from among the top 10 in Thompson's 1986 margin ranks to Nos. 1 and 2 in Hartigan's top margin counties. Percentage-wise Hartig won 60 percent of the vote in 11 downstate counties. Unfortunately for Hartigan, most of his big percentage downstate victories came in far southern Illinois counties where few voters reside. Tiny Gallatin County in southeastern Illinois led with an incredible 75 percent total for Hartigan. Edgar's downstate strength was central Illinois and Winnebago County (Rockford) at the northernmost top of the stat Champaign and McLean counties — each with a major uinversity (University of Illinois and Illinois State University) and a strong GOP voting tradition — were Edgar's best margin counties. He also produced sizable margin wins in Sangamon (Springfield), Peoria and Tazewell counties in central Illinois Edgar's downstate victories came in the more populous counties. While he won fewer counties than Thompson in 1986, he won a majority. In the end, downstate gave its native son Edgar of Charleston a slight edge over Chicagoan Hartigan in battle that was much closer than most predicted. With Chicago not producing for Hartigan, perhaps the best analysis of the 1990 Illinois gubernatorial election comes from a longtime Democratic political operative, who saw former Chicago Mayor Harold Washington as the key to the election: "It's ironic that Harold cost Neil the state mansion twice . . . once while he was alive and also after he died." The reasoning for this provocative assertion is as follows: In 1985 Washington's support for the gubernatorial candidacy of Stevenson forced Hartigan to withdraw from the 1986 Democratic gubernatorial primary; in 1990 without Mayor Washington to rally black Chicagoans to the Democratic standard, Hartigan lost to Edgar. From Machiavelli to Washington, power and politics remain the same. You need a prince to reward or punish. Paul M. Green is director of the Institute for Public Policy and Administration, Governors State University. He acknowledges the helpful assistance of Mary Jane Fields and Merle Janowitz at the State Board of Elections and Connie Kaplan and Eunice Coorlis at the Chicago Board of Elections. 18/February 199 I/Illinois Issues |
|||||||||||||||||||||||||||||||||||||||||||||||||||||||||||||||||||||||||||||||||||||||||||||||||||||||||||||||||||||||||||||||||||||||||||||||||||||||||||||||||||||||||||||||||||||||||||||||||||||||||||||||||||||||||||||||||||||||||||||||||||||||||||||||||||||||||||||||||||||||||||||||||||||
|
|