|
Home | Search | Browse | About IPO | Staff | Links |
|
Home | Search | Browse | About IPO | Staff | Links |
|
BENEFITS OF ILLINOIS PARK
prepared
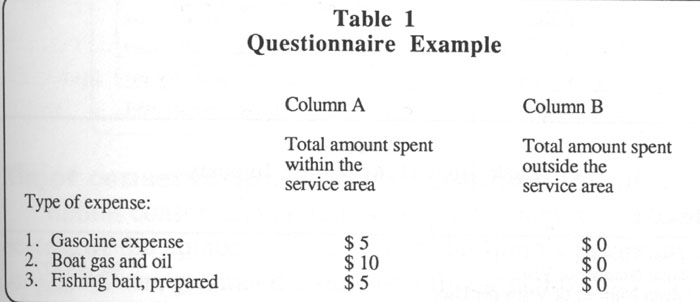
by Throughout the 20th Century, Illinois, with its innovative system of independent special districts, has remained on the cutting edge of the delivery of first rate local recreation opportunities. A cornucopia of parks, greenways, swimming pools, lakes and reservoirs, tennis courts, golf courses, and recreation centers dot the landscape in towns and cities throughout Illinois. The lives of residents in communities like Macomb, Elmhurst, Peoria, Bement, Granite City, Troy, Grayville, Carbondale, and Highland Park are enriched because of the local recreation opportunities available to them. The realization that Illinoisans have seen an improvement in the quality of their lives because of public local recreation opportunities is wide- spread, Also of interest to many Illinois residents is the following question. What other benefits have been contributed by park, forest preserve and conservation districts to the residents of Illinois? During 1988, the Illinois Conservation, Park and Recreation Foundation (ICPRF) solicited proposals for a study to determine the economic impact that park, forest preserve and conservation districts have in Illinois. In doing so, the ICPRF recognized that the economic benefits of publicly delivered leisure services are but one aspect of the benefit issue. However, to quantify a portion of the benefit picture, an assessment of the economic impacts to the Illinois economy was necessary. After almost two years, the results of this assessment are completed. How the study was completed To complete this study, three separate data collection efforts! were used. Two of these focused upon Illinois residents to determine either actual visitor expenditures or to determine residents' opinions about current leisure services and willingness to, pay. The third focused on Agency expenditures. For the two Illinois residents surveys, a sample of 15,000 households was randomly selected from five regions: Chicago, Northern Illinois, Eastern Illinois, Western Illinois, and Southern Illinois. The sample was stratified by both population density and Illinois Parks and Recreation 8 March/April 1991 geographic region. County boundaries and interstates 55 and 80 were used to divide the state into the five regions. Furthermore, since a large segment of the Illinois population lived in Chicago, a larger proportion (62%) of subjects was selected from the Chicago area. It was also noted that a large proportion of Chicago residents had unlisted numbers; therefore, 80 percent of the Chicago sample was selected from telephone books and 20 percent was generated from a computerized random numbers generator. Subjects were initially contacted by phone. In the first sample, the phone call was used to determine if subjects were park, forest preserve or conservation district users and if they were willing to complete a visitor expenditure questionnaire. As an incentive, each individual was offered a Take Time for Fun® T-shirt if they completed and returned the questionnaire. Five thousand five hundred seventy-nine telephone calls were made to determine subjects willingness to participate. From these calls, 1,749 were eligible and agreed to participate (31.35% eligibility and acceptance rate) and 616 actually completed and returned the questionnaire (35.2% return rate). The visitor expenditure questionnaire asked subjects to record all expenses made during their last visit to a park, forest preserve or conservation district facility. For example, a person and her friend spent $5 on gasoline to travel to their favorite fishing spot at a lake operated by the park district. In addition, they spent $ 10 on gas for their boat and bought $5 worth of bait minnows for their visit. They split the gasoline expenses, each paying $2.50. Table 1 shows how this information was recorded:
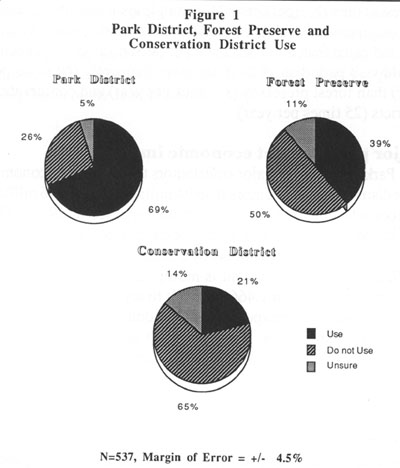
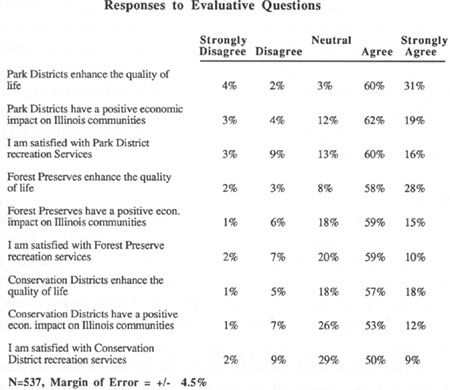
In the second sample, 1,297 residents were asked to complete the willingness to pay and issue evaluation questionnaire by phone. Five hundred thirty-seven completed the survey (41.40% acceptance rate). Subjects were first asked to respond to questions indicating their satisfaction with park, forest preserve and conservation districts. Then, using a contingent valuation procedure, subjects were asked to indicate how much they would be willing to pay for a single visit. For example, the interviewer would ask, "Would you be willing to pay $3 for a single visit to a park administered by an Illinois park district?" If the respondent answered yes, the interviewer would raise the amount by $1 increments until a "no" response was attained. If the subject initially answered "no" to $3, the interviewer dropped the amount to $2, then $1 and finally $0, until the subject answered "yes." For the third data collection effort, each park, forest preserve and conservation district was asked to submit 1989 expenditure data categorized into 528 modeled commodities used by IM- PLAN. Forty-nine park districts and six forest preserves submitted useable data. IMPLAN is a micro-computer input/output model used for regional economic analysis. It was developed by the USDA Forest Service in cooperation with the Federal Emergency Management Agency and the Bureau of Land Management to assist the Forest Service in its land and resource management planning efforts. In this study, IMPLAN was used to construct an input/output model of the Illinois economy and to estimate economic multipliers for park district and forest preserve leisure services. Limitations of the Study Many aspects of the benefits- issue were not addressed by this study. For example, the economic marketplace does not directly capture — monetary transactions or exchanges do not always directly occur; user and other fees are not always charged; and prices as an indication of worth or value for services or societal conditions are difficult to determine since they often do not exist — many of the benefits — wellness, crime reduction, enhanced quality of life, clean air, biological diversity, wildlife habitat, etc., — from "public goods." In addition, some information was not available for input into the economic impact assessment. This includes expenditures of non-Illinois residents (tourists); the expenditures of conservation districts; and the value Illinoisans place on the plethora of public recreation services provided at little to no additional charge. It would be logical to assume that if these values were obtained and used, both the estimated economic impact and the estimate of total benefit would be significantly higher. Results Based upon the willingness to pay survey, figure 1 shows the distribution of adults who stated that they use park, forest preserves and conservation district services. As expected, a majority of the respondents (69%) said they use park district facilities and a statewide majority (50% and 65% respectively) stated that they do not use forest preserve and conservation district facilities. Table 2 shows the result of three evaluative questions asked of adults in the sample. Responses show that more than nine out
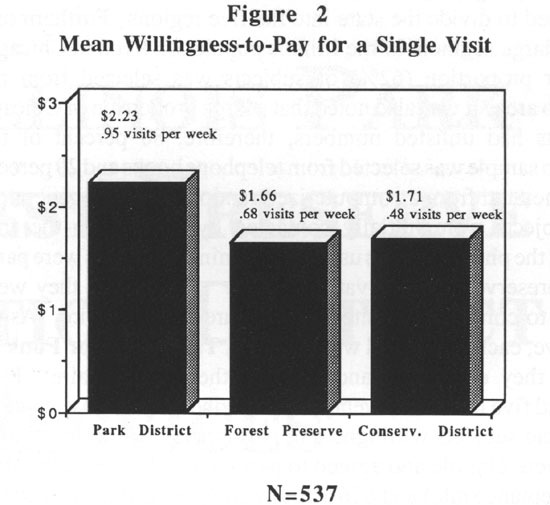
Illinois Parks and Recreation 9 March/April 1991 of 10 Illinoisans value the contribution park districts make to the quality of their lives. Similar results were found for both forest preserves and conservation districts, however, the belief was not as widely held. More than eight out of 10 Illinois residents believe that park districts have a positive economic impact on Illinois communities. This exceeds the number of residents who have similar beliefs concerning the economic impact of both forest preserves and conservation districts by 7 percent and 13 percent respectively. Also, the majority of Illinois residents are satisfied with the services delivered by park districts (86%), forest preserves (69%) and conservation districts (59%). Figure 2 displays the results of subjects' willingness to pay for park, forest preserve and conservation district facility use. Figures
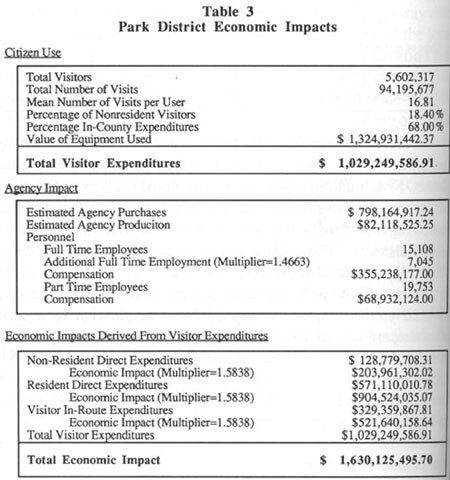
represent the value (per person) for a single visit. Results indicated that subjects were willing to pay more to use a park district. Results also indicated that, at the assigned per-person value, respondents would visit park district facilities more frequently (49 times per year) than forest preserves (35 times per year) and conservation districts (25 times per year). Major park district economic impacts Park districts are major contributors to the Illinois economy. Park districts generated more than 94 million visits by 5.6 million visitors who incurred direct visitation expenses in 1989. The impact of the visitor and agency expenditures are multiplied throughout the Illinois economy by a factor of 1.583 8. The impact of direct agency employment is multiplied throughout the state economy by a factor of 1.4663. That is to say that for every dollar in agency and visitor expenditures, an additional $0.58 is generated in other industries. For every 100 agency employees, an additional 47 jobs are created in the state. In aggregate, park districts contributed more than $ 1.6 billion to the Illinois economy and created, beyond the employment of agency personnel, an additional 7,000 Illinois jobs. In addition, Illinois park districts managing travel and tourism attractions — museums, zoos, aquariums and stadiums — generated more than 4.3 million visits by tourists from Illinois. More
than 800,000 state residents—almost 7 percent of all adult Illinois citizens — visited park districts' tourism attractions. These visitors traveled in recreational vehicles and used cameras and other types of equipment valued at nearly $560 million. At a minimum, park districts contributed $207 million in travel and tourism expenditures to the Illinois economy. The Chicago Park District alone is responsible for contributing more than $41 million in travel and tourism expenditures to the Cook County economy from more than 350,000 Illinois residents who
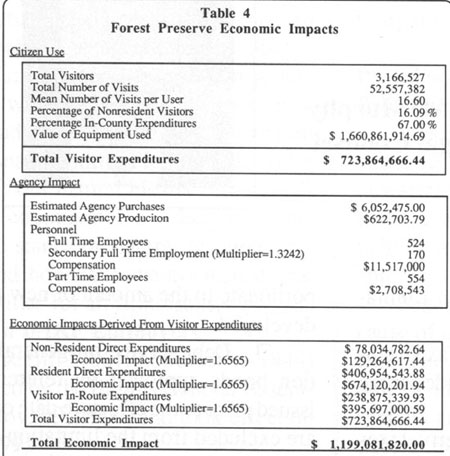
Illinois Parks and Recreation 10 March/April 1991 reside outside Cook County. Illinois tourists generated $112 million dollars in trip-related expenditures while in route to park district managed attractions. Major forest preserve district economic impacts Forest preserve districts, used by about 39 percent of adult Illinois residents, rival park districts in terms of their overall contribution to the Illinois economy. Forest preserve visitors, 3.2 million of them incurring direct trip expenses and accounting for almost 53 million visits, contribute $1.2 billion to the Illinois economy. This contribution is based on a multiplier of 1.6565. Forest preserve districts, which number about 10 percent of the number of Illinois park districts, have a multiplicative employment effect of 1.3242 and thus create an additional 32 private sector jobs for every 100 agency employees;
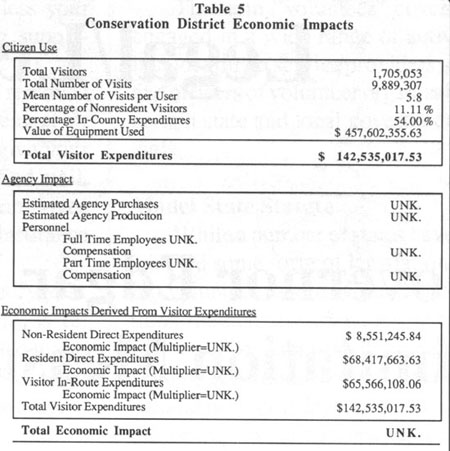
Major conservation district economic impacts Illinois conservation districts, which account for less than 2 percent of the number of agencies in the Illinois public leisure service system, generated about one-fifth the number of visits — almost 10 million — as did forest preserve districts. Approximately 1.7 million state residents — almost 15 percent of all adult Illinois citizens — incurred direct expenses while visiting Illinois conservation districts. At a minimum, conservation district visitors contribute $143 million to the Illinois economy. They also bring in, from more than 190,000 non-county residents, at least $8.5 million in revenue into conservation district counties. Conclusions The citizens of Illinois: are using park, forest preserve, and conservation districts leisure services; are happy with the services they receive; and are willing to pay for the services they receive. They are travelling to destinations within the state and spending money, thereby supporting local and regional economies. In fact, based upon park, forest preserve and conservation district user surveys, park district and forest preserve agency surveys and estimates of Illinois industrial interactivity from a national technology matrix, the total economic impact represents about $3.1 billion. Although this economic value does not represent the potential revenues local governments might realize by charging for all services that have been provided through tax revenue, it does indicate that Illinoisans receive economic benefit which exceed their costs for the recreation opportunities provided by park, forest
preserve and conservation districts. Furthermore, the results of this study give us the unique opportunity to set aside the argument that local recreation opportunities are only important because they contribute significantly to the quality of our lives. The data demonstrates that parks and leisure services provided by park, forest preserve and conservation districts are important economic players in Illinois. They produce goods; they purchase commodities; and they create jobs in the local economy both directly and more importantly indirectly by creating additional jobs in the private sector far beyond agency employment. Clearly, the citizens of Illinois can take pride in the positive economic benefits associated with park, forest preserve and conservation district recreation services. About the Authors: Dr. Martin R. Botkin, Western Illinois University, and Dr. Michael A. Kanters, Brock University, Canada, were the principle investigators for the research effort. Pete Pamell, Shu-min Tsui and Felix Dui were graduate research assistants at Western Illinois University and diligently provided assistance for the completion of the second white paper. Illinois Parks and Recreation 11 March/April 1991 |
|
Sam S. Manivong, Illinois Periodicals Online Coordinator |