|
Home | Search | Browse | About IPO | Staff | Links |
|
Home | Search | Browse | About IPO | Staff | Links |
|
Financing Infrastructure In Illinois Cities By NORMAN WALZER and POH P'NG*
Financing Infrastructure in Illinois Cities:
The 1980s brought troubled times for Illinois cities, especially those which depended heavily on manufacturing. The decade began and ended with recessions coupled with economic expansion in-between. Communities in rural areas experienced declines in property tax bases and increased pressures from residents to avoid higher tax rates. In addition, substantial changes occurred in Federal government assistance with reductions in the Community Development Block Grants and elimination of Federal General Revenue Sharing. Federal aid to Illinois cities between 1977 and 1987 declined 34.3 percent in 1977 dollars. Local public officials must change spending policies when revenue sources shift. General Revenue Sharing (GRS), for instance, was used by many local governments for capital projects because of uncertainty about its continuation. While Federal General Revenue Sharing was not large in 1987, its elimination meant that other revenue sources had to be found for infrastructure expenditures. When asked about responses to the elimination of Federal GRS, Illinois mayors in a 1991 survey, conducted by the Illinois Institute for Rural Affairs, said that they discontinued plans for new capital facilities first and then did not replace existing equipment according to planned schedules. This article reports results from a 1991 survey of mayors in Illinois cities of 10,000 and larger on a variety of financing issues. Statewide, 67.9 percent (125 survey responses) of the mayors responded. In particular, mayors were asked about the conditions of streets and water/sewer facilities but they also reported the budgetary outlook for FY92. Both topics suggest a need for additional attention. Infrastructure Condition Capital expenditures by cities represent a significant portion of the budget, perhaps as much as 21.6 percent according to the Census of Governments in 1987. This spending plays a special role in city finance, mainly because the expenditures can be postponed for a short period if the budget in a particular year is tight. Capital projects also can be expanded in years when the budgetary situation is especially good. Ideally, cities have a capital improvements plan and budget so that appropriate spending occurs annually to replace deteriorated structures. More often, though, public officials are concerned first with providing basic services such as police and fire protection and spending for capital projects depending on availability of funds. This can be a special problem when the infrastructure is not visible, such as with water and sewer facilities. Continued deterioration can mean costly improvements in the future when the finances may not be any better. Streets. Mayors were asked about the overall condition of streets in their municipality. Responses are not necessary based on engineering inspections but, in most instances, represent a reasonable estimate of current conditions. Of the 125 municipalities with 10,000 population or more responding to the survey, statewide, 43.2 percent reported streets in reasonably good condition with less than 20 percent requiring major work (Table 1). Approximately 39.2 percent of the cities reported that between 20 and 40 percent of the street mileage needed major repair with the final 17.6 percent reporting more than 40 percent requiring major work.
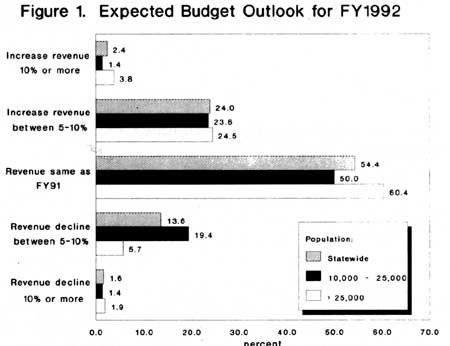
Source: Illinois Municipal League. 1991 Municipal Revenue Source Survey. Illinois Institute for Rural Affairs, Summer 1991. January 1992 / Illinois Municipal Review / Page 11 More important is the annual spending during the next five years which mayors think is needed to maintain streets. On average, mayors reported that $2.09 million per city will be required per year for the next five years for streets. This amount varies from $1.30 million in cities of population between 10,000 and 25,000 to $3.18 million in cities of 25,000 and larger. These estimates amount to $71.08 per capita and compare with an expenditure of $73.97 per capita for streets in 1987, the last year for which complete data are available. When asked about the expected spending available, mayors reported quite a bit less. In fact, they expected to be able to spend an average of $1.21 million per year in each city. This leaves an expected unfunded gap of about $880,000 per year or $29.94 per capita. Precisely how this gap will be made up, if at all, is not clear. Water Mains and Sewers. Mayors were asked similar questions regarding the condition of water mains and sewers. This infrastructure appears to be in slightly better condition than streets. Statewide, 56 percent of the cities reported that the water mains and sewers were in good condition with fewer than 20 percent needing major work. At the other extreme, only 12 percent reported that more than 40 percent of the system required major repair. As with streets, however, there is a financing gap. Mayors reported the expected annual cost for the next five years to be $1.29 million compared with an expected spending availability of $976,000 per year. This unfunded gap represents an average of $10.05 per resident. The fact that water and sewer facilities are in better condition may be explained by several factors, not the least of which is that Federal General Revenue Sharing and other financial support was available in the 1980s. This support is no longer available and whether adequate expenditures can be made in a tight economy remains to be seen. Expected Budget Outlook Given the lagging recovery of the recession, mayors were asked about the expected budget outlook for FY 1992. About half (54.4 percent) of respondents reported that FY 92 revenues will be approximately the same (between plus or minus five percent) as FY 91 (Figure 1). An additional 15.2 percent reported expected revenue decreases. Nearly one-fourth (26.4 percent) reported expected revenue increases of between five and ten percent or more.
While the expected revenue picture is not bleak, it suggests that major capital spending is unlikely. If financing gaps exist in both streets and water/sewer spending, the lack of significant growth may worsen current conditions. Certainly, not all cities are affected to the same extent by economic conditions and since large amounts of Federal aid are not likely, spending will depend on local economic performance. Conclusions Many Illinois cities must count on economic development during the 1990s to provide the revenues needed to finance public services. Economic development, at the same time, requires that infrastructure be in good condition for the city to be attractive to businesses and residents. Fortunately, according to a recent survey, much of the infrastructure seems to be in reasonably good condition. On the other hand, financing gaps were reported and the outlook for FY92 does not suggest major spending growth. What happens to the condition of infrastructure facilities will most likely depend on the performance of the local economy. If the sluggish performance of the national economy and the relatively poor condition of the state economy are any indication, some cities may well encounter difficulties making significant infrastructure improvements. * The authors are director and research associate, Illinois Institute for Rural Affairs, Western Illinois University, respectively. Gratitude is expressed to the Illinois Municipal League for printing and mailing the questionnaire. Page 12 / Illinois Municipal Review / January 1992 |
|||||||||||||||||||||||||||||||||||||||||||||||||||||||||||||||||||||||||||||||||||||||
|
|