|
Home | Search | Browse | About IPO | Staff | Links |
|
Home | Search | Browse | About IPO | Staff | Links |
|
Illinois Municipal Revenues, 1977-1987 By CAROL RACHUS and NORMAN WALZER Illinois Municipal Revenues, 1977-1987 Municipal revenues in the 1980s underwent major changes. The recession in the early 1980s eroded property tax bases in many manufacturing cities. Service jobs paying lower wages replaced many manufacturing jobs, and lower wages slow the increases in sales tax revenues. During the high unemployment and high inflation era, municipal governments searched for alternative revenue sources, one of which was fees for services. Finally, a temporary increase in the state income tax provided additional revenues for Illinois cities and counties. That increase, of course, is up for renewal in the Spring session of the General Assembly. This article examines trends in five major revenue sources during the late 1970s and most of the 1980s to provide a broad perspective on municipal revenue discussions. The interest is on changes in property taxes but, as will be pointed out later, total municipal revenues are more at issue because philosophical and management differences among cities determine the extent to which user fees and charges for services are implemented. Fifty-six Illinois cities with populations larger than 25,000 are used in the following comparisons. Nearly all of these cities have home rule authority, and therefore, have more flexibility in raising revenues than their smaller counterparts. The changes in revenues reflect management decisions rather than limits imposed by state statutes. Cities are divided into Chicago suburbs and independent (downstate) cities. The independent cities are free-standing communities which provide a broad range of municipal services to residents. Each group functions in a different economic and political environment so we might expect differences in revenue changes. Revenue Changes Statewide, total per capita municipal revenues increased 124.9 percent in current dollars from an average of $227.86 per capita in 1977 to $512.50 per capita in 1987. When the effects of inflation are removed (1977=100.0), however, the increase is 26.0 percent. The $512.50 collected in 1987 purchased only $287.12 in 1977 dollars. In 1977, the Chicago suburbs received an average of $203.13 per capita and the independents received an average of $262.59 per capita. By 1987, general revenues in the suburbs increased to $470.92 per capita compared with $569.81 per capita in the independents. In constant dollars, these increases were 29.8 percent in the cities and 21.5 percent in the independents. These comparisons are partially clouded by the presence of Federal grants for construction projects, although these may have become less common during the latter 1980s. A more disaggregated comparison by revenue type reveals several major shifts in revenue sources. Each of these is described in detail. Property Taxes. With the current discussion of limits on property tax increases, much attention is paid to the rate at which property taxes have changed. Chicago suburbs collected an average of $63.92 per resident from property taxes in 1977, compared with an average of $128.57 a decade later. This increase of 101.1 percent, however, reduces to an increase of 12.6 percent when the effects of inflation have been removed. The $128.57 per resident collected from property taxes in 1987 purchased $72.03 per capita in 1977 dollars. The trends in independent cities are much different. In 1977, independent cities collected an average of $66.18 per resident from property taxes, slightly more than the Chicago suburbs. By 1987, however, independents collected substantially less per capita than the suburbs. In fact, when price increases are removed, independent cities collected 14.7 percent less from property taxes than they had ten years earlier.
The decrease in constant dollars can be explained January 1992 / Illinois Municipal Review / Page 21 by several factors. Certainly not the least is the relatively high unemployment and poor performance of the economies during the national recession. Peoria, Rockford, Danville, and Decatur are examples of Illinois cities hit particularly hard by the recession. Cities in DuPage and surrounding collar counties have fared much better. As their tax base increased, so did their property tax collections. Also true, however, is that municipal officials had to increase tax levies in order to collect property taxes. Therefore, they must have had an active spending program, probably to accommodate residential and business growth within the community. Sales Taxes. Suburbs and independent cities differed very little in sales tax collections. In 1977, suburbs collected an average of $44.78 per resident from sales taxes compared with an average of $46.73 in the independents. By 1987, suburbs collected $96.08 per resident compared with an average of $92.18 per capita in the independents. The increase in constant dollars in the suburbs was 20.2 percent compared with an increase of 10.5 percent in the independent cities. These differences in growth rates are explained by the economic conditions in the two groups of cities. Independents faced much greater economic difficulties in the 1980s and did not participate nearly as rapidly in the economic expansion as did the suburbs. Many of the downstate cities also experienced population declines in the 1980s. Charges and Fees. The major increase in revenues during the 1980s came in the form of charges and miscellaneous revenues collected by cities. In 1977, the suburbs collected an average of $28.79 per resident from charges and fees compared with an average of $110.71 per capita in 1987, an increase of 284.5 percent. Independent cities, on the other hand, went from an average of $60.12 per resident in 1977 to an average of $208.21 a decade later for an increase of 246.3 percent. Removing inflation brings the increases to 115.4 percent for suburbs and 94.0 percent for independents. The comparisons of charges and miscellaneous revenues between the city groups is complicated by differences in governmental organization. Suburban cities do not provide as many services as independent cities. The Metropolitan Sanitary District, for instance, serves some of the suburbs, whereas sewer and water fees are included as charges for many independent cities. Shifting the financing of public services from property taxes to user charges has an unintended side effect, namely overall property taxes are deductible from individual income taxes whereas user fees are not. Thus, in some instances, the after tax income may be reduced with growing reliance on user charges. Federal Assistance. One of the main issues affecting cities during the 1980s was the trend of the Reagan Administration to reduce Federal involvement in local government affairs. Financially, this meant attempts to shift the financing of services to state and local governments. One of the most visible actions during the 1980s was the elimination of Federal General Revenue Sharing (1987) which had been in place since 1972. By the end of the program, General Revenue Sharing did not represent a major revenue source to most municipalities, but they spent a major portion of the funds for capital purposes such as streets, sidewalks, and so on. Loss of these funds often meant a reduction in expenditures for infrastructure. Federal intergovernmental aid increased in current dollars during the 1980s from an average of $10.97 per capita in Chicago suburbs in 1977 to an average of $17.63 per capita in 1987. In 1977 dollars, however, there was a decline from $10.97 per resident to an average of $9.88 ten years later. Independent cities tend to receive larger amounts of revenue through Federal aid because they are older, poorer, have more economic distress, and provide a broader range of services. In 1977, independent cities received an average of $34.61 per resident compared with $49.45 in 1987. In constant dollars, however, independent cities were hurt much more by the loss of Federal aid from an average of $34.61 per capita in 1977 to an average of $27.70 per resident in 1987. State Intergovernmental Aid. State support for municipalities has increased in both current and constant dollars. The main revenues received by cities are the state tax on motor fuels and a sharing in the state income tax. The Build Illinois program, administered by the Department of Commerce and Community Affairs makes grants available to cities for a variety of purposes and the inclusion of these grants can distort comparisons. In 1977, suburbs received an average of $28.29 per resident from state sources and in 1987 received an average of $54.75, an increase of 93.5 percent. Independent cities received an average of $39.98 per resident in 1977 and $73.32 per resident in 1987. In 1977 dollars, independents received an average of $41.08 per resident. This average, however, includes large grants to Quincy, Bloomington, and Galesburg which were not annual allocations. An alternative way to examine state intergovernmental aid is to look specifically at per capita state income tax and motor fuel tax payments, the two largest programs through which all cities receive revenues. These are distinct from programs such as Build Illinois. In 1977, cities received $13.19 per capita from the state income tax and $16.42 from the motor fuel tax program. In 1987, cities received $24.93 from the state income tax and $16.42 per capita from the motor fuel tax program. In constant dollars, the income tax receipts increased Page 22 / Illinois Municipal Review / January 1992
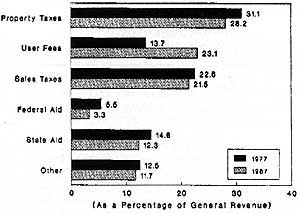
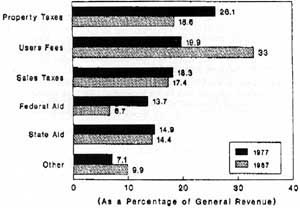
from $13.19 per capita to $13.97 per capita. Motor fuels taxes in constant dollars declined from $12.11 per capita to $9.20 per capita during the decade. Relative Importance of Revenue Sources While a comparison of percentage changes in revenue sources provides insights into how important each revenue source is, shifts in importance can be seen more directly in Figure 1. It might surprise many residents to know that property taxes have declined in relative importance as a city revenue source. In the Chicago suburbs property taxes represented 31.1 percent of general revenue in 1977 and decreased to 28.3 percent ten years later. Federal aid declined from 5.5 percent in 1977 to 3.3 percent in 1987. Even state intergovernmental aid decreased from 14.6 percent to 12.3 percent during the 1980s. The main increase was in charges and miscellaneous revenues which increased from 13.7 percent to 23.1 percent during this period. Somewhat similar trends exist in independent cities with property taxes declining from 26.1 percent of revenues in 1977 to 18.6 percent in 1987. These cities were particularly affected by decreases in Federal intergovernmental aid from 13.7 percent in 1977 to 6.7 percent in 1987. As was true in suburbs, charges and miscellaneous revenues increased markedly from 19.9 percent to 33.0 percent of total municipal revenues. Summary The structure of revenues collected by Illinois municipalities changed substantially during the 1980s. The recession in the early 1980s, combined with high inflation, brought considerable fiscal stress to many large cities dependent on manufacturing. The following recovery differentially affected cities, depending on location. Cities in the collar counties fared better than cities downstate. The statewide comparisons indicate widely differing experiences in revenue changes by Illinois municipalities. These differences are caused by differential changes in property tax base as well as management attitudes by local officials. Statewide attempts to limit property taxes must, in some manner, recognize these differences among cities in revenue raising potential and past revenue growth. The authors are research associate and director, Illinois Institute for Rural Affairs, Western Illinois University, respectively. January 1992 / Illinois Municipal Review / Page 23 |
||||||||||||||||||||||||||||||||||||||||||||||||||||||||||||||||||||||||||||||||||||||||||||||||||||||||||||||||||||||||||||||||||||||||||||||||||||||||||||||||||||||||||||||||||||||||||||||||||||||||||||||||||||||||||||||||||||
|
|