 |
Home | Search | Browse | About IPO | Staff | Links |
|
Home | Search | Browse | About IPO | Staff | Links |
|
1990 Municipal Compensation Package
By NORMAN WALZER and POH CHING P'NG*
Compensation for employees represents the largest cost paid by cities and, in some departments, represents more than three-quarters of the total expenditures. Wages competitive with private industry and other public agencies are necessary to attract qualified and productive employees. Thus, in budgeting and planning future operations, it is especially important for local officials to monitor the costs, wages and benefits provided to local employees as well as those in neighboring cities. Annually, the Illinois Municipal League publishes a comprehensive compensation survey that provides detailed information on money wages and employee benefits. The information is used to compare compensation packages among cities, by region and size. This article summarizes the average salaries paid and estimates the cost of several large categories of employee benefits paid in 1990. Money Wages Changes in money wages between 1989 and 1990 are computed for municipalities larger than 10,000 responding to the Illinois Municipal League Compensation Survey questionnaire. This survey routinely elicits responses from 85 to 90 percent of cities larger than 5,000. Therefore the sample is representative and only relatively minor variations in the averages arise due to sample differences between the various years. The wage information is collected for pay plan minimum and maximum, rather than average wage paid to a specific employee. While actual pay is more useful, detailed data on wages paid by rank are difficult to collect from a mail questionnaire. On average, the money wage increases ranged from 4 percent for bookkeeper/clerk to 7.4 percent for fire-fighters (Table 1). Building custodian was selected as a representative worker within the city and the reported pay increase for this position was 5.5 percent. An average increase of between 4.0 and 5.0 percent is compared with the Consumer Price Index increase of 5.4 percent during the same period. Thus, it appears that many municipal employees gained slightly relative to inflation during 1990. Employee benefits also increased more rapidly than inflation. Table 1. Average Salaries by Position for cities above 10,000 population.
Table 2. Employee Benefits
Employee Benefits Municipal compensation packages include many employee benefits including insurance, time-off, clothing allowances, educational programs, car allowances, and other activities. Cities differ widely in benefits provided and many benefits are difficult to measure because they are used more in some cities than in others. In the following analysis, several of the larger benefits are examined with the costs determined as though employees made full use of the benefits provided. a. Time-Off Benefits. Some employee benefits provide time-off from work, such as vacations, sick leave, and personal days. The average number of vacation days and paid holidays to which municipal employees are entitled has not increased substantially in recent years. The costs of these benefits increase with increases in money wages. A two week vacation, in terms of lost time, costs the average city $805, an increase of 5.6 percent from 1989. Providing ten paid holidays costs and additional $805 per year. The costs associated with the time-off benefits are evaluated at a worker's pay. During vacations, especially, cities typically hire temporary help at lower wages and/or other employees make up some of the work time lost. If employees are replaced at current Page 22 / Illinois Municipal Review / June 1992 wages, however, the cost would be as estimated. The average city provides 12 days of sick leave at a cost of $966, based on the building custodian as the representative employee. Not all employees use their full sick leave allotment but a city faces this cost when they do. Again the number of sick leave days allowed did not change. While a 15 minute break seems minor, it is interesting to determine the total cost of the time lost spent on breaks in a year. Breaks improve productivity and attitude but they represent a significant time allotment by the end of the year. In fact, 30 minutes per day in breaks represents $1,308 annually, more than either vacation time, paid holidays, or sick leave. Because replacement employees are not usually hired to replace employees on breaks, the costs of breaks is not computed in the total benefit cost. Break costs are included for information purposes only. The total cost of the time-off benefits is $3,884, an increase of 5.7 percent from the previous year, slightly more than inflation. Compared with average money wages paid to a building custodian of $20,927, the time-off benefits represent 18.6 percent of the base salary. Because the number of days off has not changed, this percentage has been stable in recent years. b. Security. In addition to time-off, other benefits are provided giving security to employees during illnesses or payments to beneficiaries at death. These benefits mainly involve insurance and the costs increase with coverage and premiums. Social Security and IMRF coverage are computed at the percentages reported in the Compensation Survey times the base salary. In 1989, the annual cost of estimated at $3,105 and in 1990, was $3,595, an increase of nearly 16 percent. Both the salary and percentage paid increased during this period. Hospitalization insurance costs also increased substantially. Cities paid an average of $2,008 per employee in 1989, and in 1990, paid $2,197, an increase of 9.4 percent. The rising health and hospitalization insurance costs are well-recognized as a growing concern. Life insurance costs, on the other hand, increased only very slightly. Worker's compensation insurance costs increased dramatically but comparable estimates of actual rates paid are difficult to compute. For comparison purposes, the manual rate for municipal employees (code 9410) have been used. In actually determining rates for cities level, this rate is adjusted by an experience factor. Thus, even though the manual rate increased from $6.85 per $100 salary to $10.47 per $100, the experience factor in a specific city may determine the rate charged. Nevertheless, worker's compensation costs bear monitoring given the information used in computing these costs, recognizing the problems with comparisons. Employee benefit costs increased from $10,298 to $12,020 from 1989 to 1990. This compares with an increase in the base salary from $19,815 to $20,927 for a building custodian. A significant portion of the reported increase, however, is in worker's compensation and 1990 may have been unusual. Figure 1. Trends in Employee Compensation
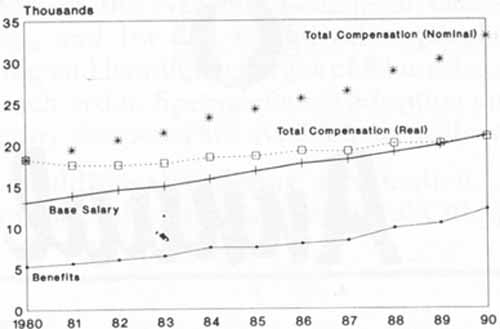
Trends in Employee Compensation
June 1992 / Illinois Municipal Review / Page 23 Employee benefits continue to increase relative to money wages. In 1989, the benefits were 52 percent of base salary and by 1990 were 57.4 percent. One also must understand that not all benefits provided by cities are included in these calculations. In some instances, educational benefits such as tuition reimbursements are provided. In other cases, a clothing allowance is provided. Counseling and many other types of programs offered substantially increase the benefits compared with money wages. The unfortunate aspect of many benefits is that they are difficult to measure and may go largely unnoticed until a fiscal crisis develops. Trends in employee compensation, by component, are presented in Figure 1. There is little doubt but that much of the rising costs of public services result from wages and benefits paid. City governments, especially during tight labor markets, are forced to pay wages competitive with private industry. Thus, increases in productivity in private industry may transfer to the public sector as city governments attempt to hire high quality employees. Productivity increases in private industry, which may not be available to the public sector, can raise public sector wages through the competitive process. Not hiring high quality public employees, on the other hand, can mean even higher costs in terms of lost productivity. Summary Wages and salaries of public employees continue to increase at approximately the same rate as the Consumer Price Index. Employee benefits, however, are a growing part of the total wage package, based on the information available. Between 1980 and 1990 (Figure 1), total compensation of municipal employees increased from an average of $18,222 to $20,774 in constant dollars. Thus, during the past decade, they gained approximately 14 percent in real purchasing power based on the information in this article. Rising compensation costs are an important consideration in managing cities and local officials can benefit substantially from monitoring these trends. Even the relatively simple approach presented in this article can assist in determining the overall costs of providing services. • Page 24 / Illinois Municipal Review / June 1992 |
||||||||||||||||||||||||||||||||||||||||||||||||||||||||||||||||||||||||||||||||||||||||||||||||||||||||||||||||||||||||||||||||||||||||||||||||||||
|
|