By KRAIG LOUNSBERRY
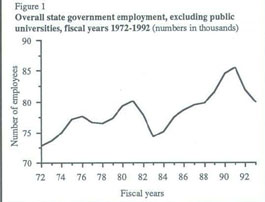
The level of state government employment in Illinois has been on a roller coaster that appears to turn up, then down on the strength of the economy, rather than in response to demand for services.
The state of Illinois is by far the largest employer within the state, and thus its trends are signficant. Employing 85,965 job holders as of 1991, exclusive of public universities, Illinois state government ranks first as the top employer in the state, followed by the U.S. government, the Chicago Board of Education and the city of Chicago. Sears Roebuck ranks fourth and is the largest private employer with just under 40,000 employees. (See table 1.)
The raw employment trend data displayed here are mainly descriptive of the last 20 years, pointing to where and when increases and decreases occurred. Employment figures are from the Office of the Comptroller's Monthly Comparative Payroll Statistics and specifically for the month of March from 1972 to 1992. (March was chosen because it is a relatively stable employment month; for instance state employment increases during summer and winter school breaks.) This data represents the initial phase of an on going study by the Illinois Tax Foundation on performance, efficiency and state employment in Illinois state government.
Table 1
15 largest employers in Illinois, 1991
Rank
Employer
Employees
1
State of Illinois
85,965
(excluding universities)
2
U.S. government
68,989
(excluding Post Office)
3
Chicago Board of Education
48,639
4
City of Chicago
41,664
5
Sears Roebuck
39,645
6
U.S. Post Office
35,010
7
Jewel/Osco
34,151
8
Caterpillar
30,853
9
Illinois Bell
27,079
10
University of Illinois
24,817
11
Cook County
22,687
12
AT&T
21,861
13
Commonwealth Edison
18,842
14
United Air Lines
17,024
15
Motorola
16,647
Source:U.S. Department of Commerce, Illinois
Comptroller, Illinois Department of Employment
Security and Dun & Bradstreet.
For a better understanding of state employment trends, a more complete picture than the mere overall employment numbers is necessary. Grouping the so-called code departments and other major state agencies into various categories provides some insight into employment trends for individual agencies as well as for groups of agencies with related missions or similar purposes. (Departments organized under the Adminstrative Code are referred to as "code" departments, but myriad other agencies, commissions, boards and authorities operate in state government.)
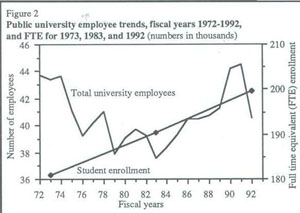
While Illinois state government is the state's No. 1 employer, without counting public universities' employment, trends within that higher education sector are also signficant, comparable in total employment to Sears Roebuck. Since 1972, public university employment has decreased. Illinois' 12 public universities employed 40,588 people in 1992, which was 3,102 or 7.1 percent fewer employees than in 1972. The years between the two
14/January 1993/Illinois Issues
While public university employment decreased, full-time equivalent student enrollment in public universities increased 10.4 percent since 1973, indicating that the overall efficiency of public universities has improved since the early seventies. (See figure 2.) In 1972, for example, the student to employee ratio in the state's public universities was 4.2:1, while in 1992 it was 4.9:1. Thus, public universities have handled an increase in demand for their services while cutting back on their number of employees, which, taken in and of itself, indicates greater efficiency or plainly speaking, more bang for the buck.
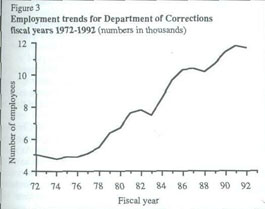
The Department of Corrections is a state agency where employment has been driven by demand of its prison population. That population went from 6,100 in 1973 to more than 31,000 in 1992, and it is expected to grow to 45,000 by the year 2000, according to projections by the Department of Corrections. (For details on prison popula-
January 1993/Illinois Issues/11
1972
3,089
22,910
6,953
1,045
33,997
1973
3,101
22,592
7,922
1,164
34,784
1974
3,133
20,799
9,060
1,188
34,180
1975
3,015
20,655
9,531
1,182
34,393
1976
45
3,041
20,002
9,674
1,037
33,799
1977
49
2,626
19,622
9,676
1,060
33,033
1978
70
2,508
19,128
9,254
1,025
31,985
1979
87
2,494
18,288
9,323 952
31,144
1980
104
2,053
18,371
8,961 1,109
1,907
659
32,505
1981
104
2,275
17,519
9,281 1,079
1,918
621
32,797
1982
97
2,326
16,188
9,243 986
1,916
614
31,370
1983
93
2,313
15,117
8,448 918
1,897
616
29,402
1984
101
2,263
14,073
8,375 969
1,938
611
28,330
1985
101
125
2,626
13,720
8,685 1,069
1,956
645
28,927
1986
119
131
2,588
13.005
9,194 1,161
2,062
728
28,988
1987
128
124
2,683
13,090
9,465 1,217
2,047
806
29,560
1988
130
124
1,696
13,483
9,663 1,221
2,040
777
29,134
1989
130
143
2,826
13,752
9,629 1,253
2,046
814
30,593
1990
130
174
3,009
14,021
10,005 1,303
2,055
862
31,559
1991
134
183
3,298
13,638
9,779 1,334
2,040
972
31,378
1992
105
167
3,231
12,839
9,489 1,291
2,001
941
30,064
Source:
Office
of the Comptroller's Monthly Comparative Payroll
Statistics,
March 1972-1992.
tion, see forth coming Tax Facts published by the Taxpayers' Federation of Illinois.) More prisoners will likely require more employees, so growth in the Department of Corrections and in the public safety sector overall will probably continue into the 21st century.
In the category of human services, employment decreased 14 percent from 1972 to 1992, with the most dramatic reduction in the number of employees at the Department of Mental Health and Developmental Disabilities, accounting for most of the human services drop. Mental health employment fell from 22,910 in 1972 to 12,839 in 1992, a decrease of 43.2 percent, while three other departments in this category Public Aid, Public Health and Children and Family Services show increases in their employment numbers since 1972. (See table 2.) In addition, the four human services departments set up since 1972 are also up from their beginning year employment numbers.The four newer departments are the Department on Aging, Department of Alcohol and Substance Abuse, the Department of Rehabilitative Services and the Department of Veterans Affairs.
The human service agencies, however, are currently among the many agencies under the budget knife. Employment figures for all human service agencies have fallen from their 1991 levels, which were 20-year highs except for mental health. Further cut backs this past summer, most notably at the Department of Children and Family Services and the Department of Public Aid, will send these figures downward, closer to their numbers of two decades ago.
While employment in the constitutional officers category increased about 9.4 percent from 6,989 in 1972 to 7,644 in 1992, there was no general trend. The category includes the one group where employment increased dramatically from 471 in 1972 to 1,048 in 1992. That group includes the six elected executive officers (governor, lieutenant governor, attorney general, secretary of state, comptroller and treasurer), members of the General Assembly and the governor's "cabinet" (agency directors appointed directly by the governor).
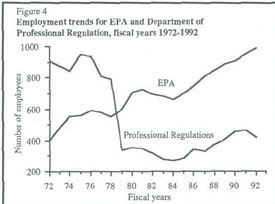
State employment increased in the category of environment and business regulation, up about 33.8 percent from1972 to 1992. This increase seems indicative of a national and even global trend of increasing environmental aware-
16/January 1993/Illinois Issues
ness. The number of employees for the Illinois Environmental Protection Agency (IEPA) grew from 399 in 1972 (two years after it was established) to 987 in 1992, an increase of 104.8 percent over this 20-year period. (See figure 4.) The Department of Conservation increased its number of employees from 1,166 in 1972 to 1,408 in 1992, and the Department of Energy and Natural Resources, which grew out of the Illinois Institute of Natural Resources and became a code department in 1982, grew from 467 to 617 employees from 1982 to 1992. In fact, the Department of Professional Regulations (formerly the Department of Registration and Education) was the only code department in this category to lose employees, going from 904 in 1972 to 419 in 1992. (See figure 4.)
Departments dealing with economic development and infrastructure collectively fell about 19 percent from15,187 in 1972 to 12,307 in 1992. Both the Department of Transportation and the Department of Agriculture lost employees: Transportation employment fell 17.1 percent from 9,594 to 7,797, and agriculture employment dropped 15.3 percent from 767 to 650. The Department of Labor's employment dropped drastically from 4,955 to 95 employees, but this decrease came mostly from the creation of the new Department of Employment Security in 1985 from a division within the Department of Labor.
New departments do not necessarily mean more employees. There are more code departments in 1992 than there were in 1972. At least five code departments exist in 1992 that did not exist in 1972, but many of them were created by combining the duties of other departments and agencies into new departments. One example is the Department of Central Management Services (CMS). CMS took over the duties of the Department of Administrative Services and the Department of Personnel. In 1992, CMS had fewer employees than both of the previous departments in 1982, their last year of operation.
CMS had 1,175 employees in 1992, while the other two combined had 1,333 employees in 1982.
The Department of Employment Security provides another example of downscaling. It was created by executive order in 1984 by upgrading part of the Department of Labor into a department (see Illinois Issues, February 1985, page 18). The combined number of employees in 1992 of the Department of Employment Security and the Department of Labor was 3,040, which is less than the 4,257 employees in the Department of Labor in 1984, the last year that employment security was a part of that department.
These 20-year employment trends pose fundamental questions for elected officials and state managers:
Will the roller coaster
of state employment stop where it is, should it stop, where it is, or will state government reduce employment to the 72,000-74,000 range of 1972 and 1983? Will the state be able to meet the needs of those it serves if employment cuts continue? For example,the Illinois Department of Revenue has reduced its workforce by 37 percent since 1986 through privatizing about two-thirds of its data entry work and by enhanced technology. Are similar reductions even conceivable for the very different services provided by the human services agencies such as the Department of Children and Family Services? What effect will a change from 4.2:1 to 4.9:1 in the ratio of public university students to employees have on the quality of education that students receive?
Answers to these questions are beyond the scope of the article. Policy analysts and elected officials will have to respond soon, however, because there are predictions of both slow economic growth during the coming decade and rapid expansion of populations served by state government's most expensive programs, such as nursing home patients, prison inmates and the poor. *
Kraig Lounsberry is a research intern for the Illinois Tax Foundation.
January 1993/Illinois Issues/17
|
||||||||||||||||||||||||||||||||||||||||||||||||||||||||||||||||||||||||||||||||||||||||||||||||||||||||||||||||||||||||||||||||||||||||||||||||||||||||||||||||||||||||||||||||||||||||||||||||||||||||||||||||||||||||||||||||||||||||||||||||||||||||||||||||||||||||||||||||||||||||||||||||||||||||||||||||||||||||||||||||||||||||||||||||||||||||||