|
The Sources Of Municipal Revenue
An Analysis of the FY 93 Financial Reports
By OSBIN L. ERVIN and CYNTHIA S. WELDON
November 28,1993
Institute of Local Government Affairs
Southern Illinois University at Carbondale and The Office of the Comptroller, State of Illinois
|
Each of Illinois' 1,281 municipalities is required to
file an annual financial report (AFR) with the state
Comptroller. The Institute of Local Government Affairs and The Comptroller's Department of Local Government Affairs jointly compile and summarize these
reports. This article is a brief summary of the revenue
information reported for fiscal year 1993 the last year
available. The city-by-city compilation and full summary of revenues, expenditures, and debt (246 pages)
may be obtained from the Institute at the cost of reproduction.
The 1,280 Illinois municipalities exclusive of Chicago raised $3,371,004,154 in general revenues in FY
931. Given the 6,782,631 Illinoisans represented by these
municipalities, this amounts to per capita revenues of
$497. 77.2 percent of these monies were collected from
local sources, while the remaining 22.8 percent were
received from intergovernmental sources.
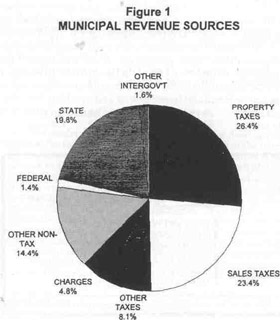
Figure 1 shows the distribution of revenues across
|
the different specific sources. Of the 77.2 percent of
revenues raised locally, the property tax is the major
producer accounting for 26.4 percent of total general
revenue and 34.2 percent of that from local sources.
The general sales tax is the second most important local
source, constituting about 23.4 percent of general revenue. Other taxes, charges, and other non-tax sources
account for the remainder of monies raised from local
sources 8.1 percent, 4.8 percent, and 14.4 percent
respectively.
The sales tax figure of 23.4 percent may understate
the importance of consumption-based taxes. This is
because the 8.1 percent shown for "other taxes" includes revenues from selective sales taxes, such as those
some municipalities levy on tobacco and alcohol products. If all sales taxes (both general and selective) were
summed, the result would be a figure very near that of
the property tax. Clearly it is taxes on property and sales
upon which municipal governments depend for own-source revenues.
|
REGIONS of ILLINOIS MUNICIPALITIES

|
Intergovernmental sources account for 22.8 percent
of the general revenues. As is indicated in Figure 1,
nearly nine-tenths is received from state sources, and,
conversely, only a very small part is provided by the
federal government. The more specific and major
sources of state monies are the shared revenues from
|
January 1995 / Illinois Municipal Review / Page 15
the motor fuel and income taxes, grants, and the personal property replacement tax,
Per capita revenue figures by region and city size
are shown in Table 2. As would be expected, municipalities of the northern region (and in all classes) collect
more monies per capita than do those of either the
central or southern regions. This doubtless is a result of
the well understood disparity in wealth between the
municipalities of the Chicago suburbs and those of the
more rural areas of the state. A further expected relationship in these figures is that of increasing per capita
revenues with increasing city size; the larger the city,
the higher the per capita revenue. Larger municipalities
generally feel need of more programs and services than
do those smaller in size, and the higher per capita figures reflect this disposition. Small cities and villages
(<1.000) in central Illinois have the lowest figure in the
state.
While the property tax is the major local source of
municipal revenue, it is not uniformly important across
the different regions and classes of cities. As shown in
Table 3, the tax varies from 41.0 percent of general
revenues in the small (<1,000) communities of the
northern region to 15.3 percent in those of the central
region, with per capita figures being $183 and $29 respectively. Northern area municipalities raise a considerably higher percentage of revenues from the property tax than those of the central and southern regions in
all size classes, and in all size classes they raise at least
twice as many dollars per capita.
|
TABLE 2
Per Capita
|
Revenues By
|
Region
|
and City
|
Size (dollars)
|
|
|
|
< 1.000
|
1,000-
4,999
|
5,000 -
24.999
|
25.000+
|
All
Units
|
|
Northern
|
447
|
443
|
537
|
570
|
545
|
|
Central
|
187
|
268
|
349
|
509
|
401
|
|
Southern
|
285
|
343
|
372
|
483
|
382
|
|
All Illinois
|
285
|
358
|
493
|
555
|
497
|
|
TABLE 3
Property Tax
|
Collection
|
by Region
|
and City
|
Size
|
|
|
|
< 1,000
|
1,000-
4,999
|
5,000-
24,999
|
25.000+
|
All
Units
|
|
Northern
% of total
Per Capita
|
41.0%
183
|
25.5%
113
|
30.6%
164
|
28.4%
162
|
29.2%
159
|
|
Central
% of total
Per Capita
|
15.3%
29
|
20.8%
56
|
20.6%
76
|
16.8%
88
|
18.1%
71
|
|
Southern
% of total
Per Capita
|
24.6%
70
|
16.6%
57
|
19.1%
71
|
16.0%
77
|
18.2%
68
|
|
All Illinois
% of total
per capita
|
28.7%
82
|
22.4%
80
|
28.4%
140
|
25.6%
142
|
26.4%
130
|
|
TABLE 4
FY:93 State
|
Aid by
<1, 000
|
Region
1,000-
4,999
|
and City
5,000-
24,999
|
Size
24.000+
|
|
|
Northern
|
20.1%
|
19.4%
|
16.8%
|
17.3%
|
17.3%
|
|
Central
|
41.4%
|
31.7%
|
29.3%
|
24.5%
|
27.2%
|
|
Southern
|
34.1%
|
25.2%
|
24.8%
|
30.5%
|
27.2%
|
|
All Illinois
|
30.4%
|
23.9%
|
18.8%
|
19.3%
|
19.8%
|
Table 4 provides further data on the major source of
intergovernmental revenue state aid. With respect to
region and size class, municipalities of the central and
southern regions depend more on state aid than do
northern municipalities, and the state's smallest municipalities regardless of region are generally more dependent than larger units on state assistance. The small
(<1,000) municipalities of the central region are most
dependent on the state, receiving 41.4 percent of general revenues from state sources. In general, there is an
inverse relationship between use of and dependence on
the property tax and dependence on state monies. As
the property tax as a percentage of general revenue
increases, state aid as a share of the total decreases.
In an effort to identify any recent trends in the
structure of revenue sources, the FY 93 information was
compared with that of the FY 88 AFR's. As shown in
Table 5, the relationship between own-source and intergovernmental revenues changed little over this five
year interval. The ratio of own-source to intergovernmental revenues was a little under 4 to 1 in 1988 as in
1993. However, within each of these categories there
were considerable shifts from one to another of the
different specific sources. In the "own-source" cate-
Page 16 / Illinois Municipal Review / January 1995
gory, changes for services and taxes other than those on
property and general sales show a considerable increase in their importance in the revenue structure. On
the other hand, sales taxes and non-tax revenues (other
than charges) are not quite as important now as in FY
88. The place of the property tax in the revenue structure is virtually unchanged at about 26 percent over the
period, while per capita collections have increased by
about 12.9 percent. In the "intergovernmental" category, the amount and relative importance of federal
dollars has declined heavily from $17 per capita and
4.0 percent of revenues to $7 per capita and 1.4 percent
of revenues, while the amount and importance of state
monies had increased significantly from $73 per
capita and 16.2 percent of revenues to $98 per capita
and 19.8 percent of revenues,
Both own-source and intergovernmental receipts
have shown a modest increase (in constant dollars) over
the 5 year period. The own-source increase is $29 per
capita (8.2 percent), and the intergovernmental increase is $16 per capita (16.5 percent). Total general
revenue receipts are up from $451 to $496 per capita, an
increase of 10.0 percent.
The shifts of the 1988-93 period are generally consistent with both national and Illinois trends of the
1980s. National data indicate that municipal governments across the country and over the last quarter-century have been making increased use of user
charges, and that direct federal assistance has been in
decline since the early 80s2. With respect to Illinois, a
1993 study of Illinois cities having a population of
25,000 or more shows an increase in the importance of
user charges, a decline in federal assistance, and an
increasing dependence on state aid3. On the other hand,
findings from the AFR's are somewhat different from
these other findings with respect to the property tax.
The conventional understanding is that the property tax
is in decline as a municipal revenue source, and this was
indeed the finding of the 1993 study of Illinois' larger
municipalities. However, there was no such decline in
Illinois over the five years of 1988-93 when municipalities of all sizes (exclusive of Chicago) are considered.
The property tax constituted about 26 percent of own-source revenues in 1988 as in 1993. There may, however, have been a decline in importance over the earlier
years of the 80s.
|
Table 5
1988 and 1993 Municipal Revenue Sources Compared
(1993 dollars)
|
|
1988
|
1993
|
% CHANGE
(1988-93)
|
|
Own Source
|
|
|
|
|
Property tax
% of total
|
25.7
|
26.4
|
+2.7%
|
|
Per capita
|
116
|
131
|
+12.9%
|
|
Sales taxes
% of total
|
25.3
|
23.4
|
-7.5%
|
|
Per capita
|
114
|
116
|
1.8%
|
|
Other taxes
% of total
|
6.5
|
8.1
|
+24.6%
|
|
Per capita
|
29
|
40
|
+37.9%
|
|
Charges
% of total
|
4.1
|
4.9
|
+19.5%
|
|
Per capita
|
19
|
24
|
+26.3%
|
|
Other Non-tax
% of total
|
16.9
|
14.4
|
-14.8%
|
|
Per capita
|
76
|
72
|
-5.3%
|
|
Subtotal
% of total
|
78.5
|
77.3
|
-1.5%
|
|
Per capita
|
354
|
383
|
+8.2%
|
|
Intergovernmental
|
|
|
|
|
State
% of total
|
16.2
|
19.8
|
+22.2%
|
|
Per capita
|
73
|
98
|
+34.2%
|
|
Federal
% of total
|
4.0
|
1.4
|
-65.0%
|
|
Per capita
|
18
|
7
|
-61.1%
|
|
Other I.G.
% of total
|
1,3
|
1.6
|
+23.1%
|
|
Per capita
|
6
|
8
|
+33.3%
|
|
Subtotal
% of total
|
21.5
|
22.8
|
+1.0%
|
|
Per capita
|
97
|
113
|
+16.5%
|
|
TOTAL
% of total
|
100
|
100
|
|
|
Per capita
|
451
|
496
|
+10.0%
|
|
In conclusion, the 1980s was a period of considerable uncertainty and change in the revenue structure of
Illinois municipalities. Municipal officials doubtless
have good recollection of the economic recession of the
early 1980s, the 1986 termination of the federal revenue
sharing program, and the debate at decade's end over
the appropriate level of state assistance. These and
other developments of the 80s have resulted in a municipal revenue structure somewhat different from that of
earlier years. Comparison of 1988 and 1993 figures especially shows a structure becoming more dependent
on state monies and charges for services, less dependent
on the federal government, and in which the place of
the property tax has been relatively stable. While it is
appropriate and useful to characterize Illinois municipal finance as a whole, the figures of this paper are also
a reminder that municipalities of different sizes and
areas have somewhat different revenue structures. Debate and public policy in municipal finance should take
account of these differences.
|
1. The reader should be aware of the following three matters
relating to the figures reported in this paper. First, 79 of the state's
1,280 municipalities (exclusive of Chicago) had not reported at the
time work on this summary commenced. Revenues of each of these
units were estimated on the basis of that reported for cities of like size
and in the same region. Second, all figures and tabulations are exclusive of the City of Chicago. (FY 93 general revenues of Chicago were
3,022,288,000, bringing total general revenue receipts to
6,393,292,154). Third, the revenue information is restricted to that of
the governmental operations of municipalities; the revenue of self
supporting enterprises (such as the municipal waterworks) and nonexpendable trusts (such as the police pension fund) are not included.
2. United States General Accounting Office, Intergovernmental
Relations; Changing Patterns in State-Local Finance (Washington,
D.C.: U.S. GAO, March 1992).
3. Norman Walzer, Pob Ching P'ng, and Carol Rochus, Financing Illinois Cities in The 1980s (Macomb, IL: Illinois Institute of Rural
Affairs, January, 1993).
January 1995 / Illinois Municipal Review / Page 17
|
