|
Home | Search | Browse | About IPO | Staff | Links |
|
Home | Search | Browse | About IPO | Staff | Links |
|
Our Natural Resources
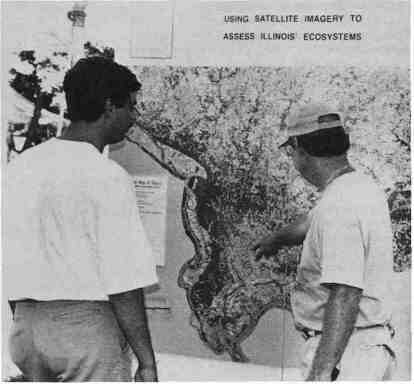
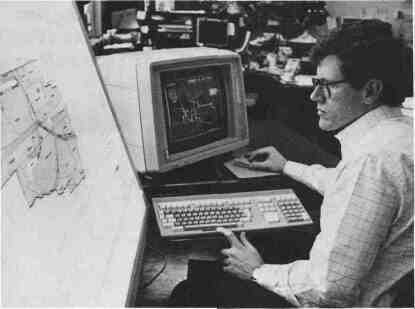
The Big Picture by Anne Mueller Satellite imagery gives IDNR map makers an eagle's eye view of the state's macrosites, and helps managers assess the status of their ecosystems. Five hundred fifteen miles above the Illinois landscape, during three of summer's hottest weeks, a French satellite circled the earth on a north-to-south orbit. In swaths slightly more than 37 miles wide, its preprogrammed electronics took images of four areas designated by the Illinois Department of Natural Resources as "macrosites"—large, generally self-contained areas deemed significant because of their ecological diversity. It was the beginning of a long-range macrosite inventory and assessment project, conducted by the Department through its State Geological Survey. The French SPOT satellite—short for Satellite Pour l'Observation de la Terre (Satellite for the Observation of the Earth)— will be reserved again this fall to take more images of the four areas: the Rock River region in northern Illinois; the Prairie Parklands macrosite which includes the former Joliet Army Ammunition Plant proposed to become the Midewin National Tallgrass Prairie; Site M in west-central Illinois; and the Cache River region in the south. Eventually the entire state will be screened systematically and data compiled to determine where other potential macrosites are located. The goal is to better preserve their high-quality streams, natural areas, and rare plant and animal species. Dr. Donald E. Luman, a senior geologist with the Illinois State Geological Survey and member of its Geologic Mapping and Framework Studies Group, says the imaging data collected this summer and fall will be combined with existing databases to create high resolution maps on 1: 24, 000 scale—1 inch equaling 2, 000 feet. "It will almost be like looking at a photo taken from a plane," Luman says of the high-resolution images he expects the maps to depict. Remote sensing and image processing is Luman's specialty. He recently completed a two-year assignment as principal investigator for a land cover mapping project, which was specified by state natural resource agencies that Gov. Jim Edgar called on to produce a Critical Trends Assessment Project. CTAP, which in the early 1990s conducted a comprehensive statewide environmental review, determined periodic satellite mapping of the state's 55, 600 square miles is needed to assess how land is being used in Illinois. In addition to calculating the amount of land being fanned and how rapidly cities are expanding, mapping every few years would allow tracking of the condition of the state's ecosystems. Unlike the macrosite assessment 44 * Illinois Parks & Recreation * September/October 1995 project, which used custom-ordered satellite imagery from SPOT, the land cover mapping project relied on a large repository of existing digital data collected by federally owned Landsat satellites. Landsat satellites first began delivering images of the earth's surface in 1972, with a scanner recording the reflection of light from the earth and sending the information to a relay satellite, which would send it to a computer at a ground station.
The images provide information to agronomists seeking details about soils and crops, foresters tracking the extent and condition of vegetation, engineers monitoring the effects of droughts and floods, and others concerned with the protection and management of natural resources. The general public also developed an interest in satellite imagery 10 years ago with the publication of a wall-size (38 by 52 inches) map of Illinois. It depicted farm fields as blue-gray rectangles and urban areas in shades of magenta and pink—an intentional false-color representation that assigned color to the invisible infrared color band so water, soil and vegetation could be distinguishable from each other. At $4 a copy, or $9 for a laminated version, the satellite image map of Illinois is still available through the ISGS Order Department. Luman, who worked on that mapping project, relied on the Landsat archives in acquiring updated digitized satellite data for his recent land cover mapping project. But while the 1985 map was done in unnatural colors on a small 1:500,000 scale, the 1995 map depicts surface features in more realistic colors on a larger 1:100,000 scale. The result is a detailed, 21 -foot-high map of the state. "It's almost shocking," Luman says. "Very imposing." Like its 1985 counterpart, the color had to be tweaked, but this time "true" colors were assigned to various surface features. Water is deep blue; agricultural row crops are the russet colors of late autumn; forested lands are a lush green; urban areas are gray to black with parklands and forest preserves within their borders showing up a bright green. In all, 24 hues are explained on the map's legend. Analysts will compare the new map to previous satellite maps to determine how the Illinois landscape has changed within the last few years. One thing they'll pay particular attention to is fragmentation of Illinois' ecosystems. An ecosystem is an interconnected system of living plants and animals along with essential features such as water required in their habitat. The general principle is that large, contiguous tracts are best able to sustain healthy, diverse ecosystems. When ecosystems are broken into smaller tracts, through natural circumstances or human influence, habitat fragmentation occurs. It is suspected there is severe fragmentation of Illinois' ecosystems. Looking at the land cover map, Luman saw evidence of it in southern Illinois. "There was a shocking portrayal that took us by surprise," Luman says. "Frag- Illinois Parks & Recreation * September/October 1995 * 45 mentation of the preglacial landscape of southern Illinois and the Shawnee National Forest is very extensive and extremely advanced." Although the land is sparsely populated and little of it is suitable for farming, human impact can be seen on once forested slopes that are now converted to pasture. "When you look at the map, you can actually see a lighter green 'halo' around the dark green forest," Luman says. "We think that was the forest's former border." Before problems can be dealt with, they first must be identified. CTAP recognized that a current land surface status report was crucial to assess changes and monitor trends. With the new land cover map completed—and with the macrosite assessment underway—Illinois has tools in place for sound decision making on policies impacting the environment. That's not to say everything the map depicts is a problem ready to be solved. "You see that Illinois is a complex and diverse state when viewed from the satellite's perspective," Luman says. "It's very impressive."
ISGS Map Information Can Be Accessed Electronically The Illinois Land Cover Map database, which will be produced on CD-ROM, soon will be available on the World Wide Web at HTTP: // DENR1IGIS.UIUC.EDU: /ISGSROOT/ ISGSHOME/ISGSHOME.HTML. It also will be part of the Illinois State Geological Survey's "open file map series" in which a map of a selected area can be printed on demand. The cost for a 24" x 30" map is expected to be about $15-20. When this service is available, it will be carried in the ISGS publication list. Publications of the Illinois State Geological Survey, a 168-page booklet that is available through the ISGS Order Department, Illinois topographic maps,showing wooded areas, wetlands and elevations (scale of 1:24,000) are available from the Illinois State Geological Survey for $3 each plus shipping and handling. For a free topo index or for more information, write the ISGS Order Department. 615 E. Peabody Drive, Champaign, Dl. 61820- 6964 or call 217-333-4747. TDD 1-800-526-0844, fax 217-244-7004. 46 * Illinois Parks & Recreation * September/October 1995 |