 |
Home | Search | Browse | About IPO | Staff | Links |
|
Home | Search | Browse | About IPO | Staff | Links |
|
You Can Count On It BY JOHN ALLEN
According to the U.S. Census Bureau, 12,419,293 people live in Illinois, an 8.6 percent increase from the 1990 census. During that same 10-year period, the state's raccoon population increased by 24 percent. Since no raccoon families returned census forms and numerators couldn't knock on their doors, one might ask how we know the raccoon population is on the rise. We counted them—sort of. Raccoon populations are tracked several ways, including the spring spotlight survey, archery deer hunter survey and the number of requests for nuisance raccoon removal permits. While they can't tell us exactly how many raccoons there are, they do tell us whether there are more or less of them. "We're more interested in population trends than the actual numbers," said John Buhnerkempe, DNR wildlife operations program manager. "We use the data to make decisions on managing populations. It gives us a good indication of the status of the environment." DNR conducts a variety of surveys to keep track of the state's animal populations. Some are straightforward counts, such as aerial waterfowl surveys, while others are less precise, such as the spring spotlight index. Illinois, in fact, is unique in the range and number of surveys it conducts, according to Dr. Craig Miller, human dimensions program leader for the state Natural History Survey. "No other states survey to this extent," he said. The Human Dimensions Program surveys the public and its attitudes toward wildlife and wildlife management. They conduct three annual surveys and a variety of one-time surveys. Annual surveys include the hunter harvest survey, waterfowl hunter survey and the trapper survey. Following are brief summaries of these surveys: • Hunter Harvest Survey: Some resident hunters are asked how often they hunted, what species they hunted/harvested and where they hunted. Responses give DNR program managers estimated statewide harvests for species, and information on hunter effort and long-term trends. Hunters might also be asked for information about use of public hunt-
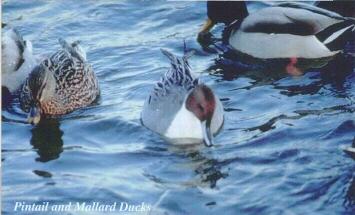
ing areas, site-specific and special hunting permits and deer hunting. "It's a way for us to gather opinions on issues," said Miller. "We can gain insight into how widespread hunter attitudes are on topics of special interest." • Waterfowl Hunter Survey: Participants are randomly drawn from hunters registering with the Hunter Information Program (HIP). Illinois uses the survey data in computing quotas for its waterfowl hunting zones. Hunters are always asked how often they hunted, where they hunted and the number of birds of each species taken. Other questions change annually and might relate to such things as the use of motorized decoys, snow goose season and reactions to possible changes in hunting zones. • Trapper Survey: Participants are randomly selected from the list of trapping license buyers. The survey seeks harvest data and also questions trappers about types of traps used, who they trapped with, why they trap and management practices. "We need to know who they are and if our management efforts are addressing their needs," Miller said. The Human Dimensions Program also conducts special onetime surveys of both hunters and the non-hunting general public. Briefly, they are: • Non-resident hunter surveys: Non-residents purchasing habitat stamps and deer permits are sent questionnaires asking how often and where they hunted, who they hunted with (outfitters, friends, family or alone), number of species harvested, where they stayed, what they bought, why they hunted here and whether they planned to return. • Homeowner surveys: Last summer 5,000 homeowners in Cook, DuPage, Kane, Lake and Will counties were randomly selected for a one-time survey. The survey showed that 55 percent of the respondents feed wildlife, and 58 percent had problems with nuisance wildlife. Wildlife causing the most problems were geese, raccoons, squirrels, rabbits and skunks. "The survey showed that people need more information on who's responsible for nuisance wildlife and where to get help," Miller said. "The data may lead us to develop more educational information for homeowners, such as how to attract or discourage wildlife." • Snow goose survey: A five-year survey running from the 1999-2000 to 2004-2005 seasons, this survey was mandated by the USFWS for all states offering the special light goose season. In addition to harvest/days hunted questions, it also asks whether hunters took advantage of the liberalized rules regarding unplugged shotguns and electronic calls.
• Illinois hunter survey: This survey measured hunters' effort and experience, reasons for hunting and access to both public and private lands. It also was sent to landowners to measure their willingness to allow hunter access. Miller said it usually takes 4-6 months to complete a survey. The process works this way: Participants are sent a letter, questionnaire and stamped return envelope. If they don't respond in an appropriate time, they receive a series of reminders. There's a code number on the questionnaire that corresponds to a number on the mailing list. When the questionnaire is returned, the name and address are deleted, leaving only the code number so that all respondents are guaranteed anonymity. At the end of each survey there is a section seeking demographic information. "We're not trying to be nosy," Miller said. "We need to know if and how their income level and age affect their attitudes." The Human Dimensions Program also conducts telephone surveys if issues arise that need a quicker response. Plans also are being made to do on-site surveys when necessary. In addition to those conducted by the Natural History Survey, the DNR divisions of Wildlife Re-
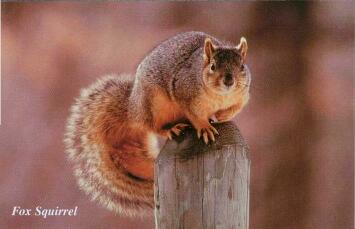
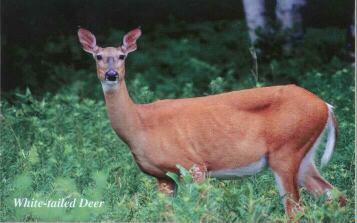
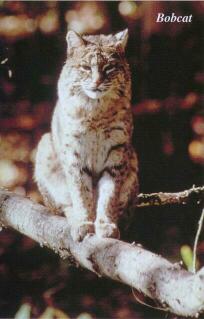
sources and Natural Heritage conduct wildlife surveys. Wildlife division surveys include: • Archery deer hunter survey: Archery deer hunters volunteer to keep logs of their hours afield and wildlife sightings (coyote, bobcat, fox, raccoon, squirrel, white-tailed deer and turkey). In 1999, a total of 1,931 hunters logged 114,559 hours afield. Results showed stable squirrel and coyote numbers, declines in fox, and increases in bobcats, deer, raccoons and turkeys. • Firearm deer check station data: Used primarily to evaluate the deer herd for population modeling, hunters are asked if they saw turkeys or bobcats. Check station personnel note the age and sex of harvested deer, as well as if females are lactating. Data have shown very little change in the numbers or age structure of Illinois' herd over the past several years. "Most states have a check-in requirement," said Forest Wildlife Program Manager Paul Shelton. "We use trained personnel at all check stations the entire firearm season, whereas most states use mail survey forms or sample only a day or two."
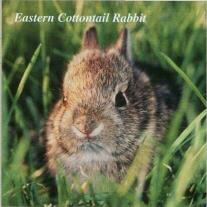
• Landowner turkey brood survey: Two thousand cooperator landowners throughout the state are mailed brood survey cards asking them to report all sightings of hens and their young in June, July and August. Biologists compare the number of young birds to the number of hens to get an idea of reproduction rates. That data is then used to set permit quotas. • Pheasant call count/pheasant brood count: From April 25 to May 15, DNR personnel drive 49 20-mile routes, stopping every mile and listening for pheasants for two minutes. They drive the same routes in August, this time recording the number of pheasants seen. • Bobwhite quail call count: DNR biologists survey 52 20-mile routes one day each June, stopping every mile and listening for two minutes. • Dove count: Doves are counted three times each year—the federal call-count in May, the breeding bird survey in June and the DNR's visual roadside counts in August. • Road-kill index: Wildlife biologists record the number of road-kill skunks, rabbits and opossums they see during normal travels year-round. The number of rabbits killed in June and July provides the estimate of the fall cottontail population. Skunk and opossum numbers are kept for a full year. This survey gives an overview of whether or not populations are increasing. • Spotlight survey: At night, just before trees leaf out, DNR personnel use a 100,000-candlepower spotlight while driving slowly along standardized 25-mile routes to detect animals by seeing their entire bodies or light reflected from their eyes. The data is used for long-term trend information on
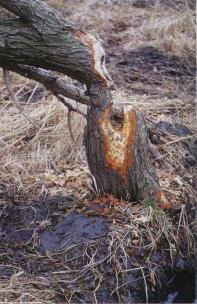
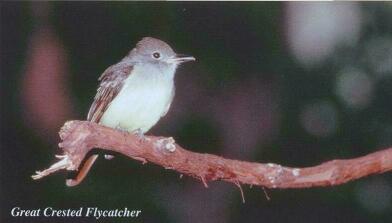
overall population fluctuations and to determine hunting and trapping season lengths. • Furbearer sign survey: Primarily designed to monitor the distribution and abundance of otters, it also gives information on the distribution of beaver and mink. Conducted from Feb. 1 to March 31 in the south zone and Feb. 15 to April 15 in the north, staff members use hip chains to measure 300 meters upstream and downstream of starting points, as well as shorelines for signs of the animals. • Aerial waterfowl surveys: These surveys document when waterfowl migrate through Illinois so hunting seasons can be set; make sure waterfowl management practices are having the desired effect; and serve as a basis for applying for federal aid for habitat improvements based on the number of birds spending time in Illinois. Because of these surveys, hunters will know where the birds are located at any given time. There also is a spring migration survey to count waterfowl from February to mid-April; a teal survey in early September; fall migration surveys to count waterfowl from Oct. 1 to the third week in December; and a mid-winter survey to count waterfowl the first week in January. Survey areas include northeast Illinois; central Illinois cooling lakes; the state's three reservoirs; the Mississippi valley; the upper and lower Illinois River; west central Illinois; and southern Illinois/western Kentucky. Surveys conducted by the Division of Natural Heritage include: • Breeding bird survey: Held in all 102 counties one day in June, volunteers conduct 50 three-minute counts of birds along roadside stops spaced a half-mile apart on predetermined routes throughout the state. • Spring bird count: Volunteers in all 102 counties count the number of bird species and the total number of each species seen on the first Saturday each May. • Colonial waterbird survey: Known heron and cormorant colonies are visited once a year during the breeding season. The number of nests and number of birds are counted to find out if the colony is still functional and if the various species can be upgraded or removed from the endangered or threatened species lists. • Shorebird surveys: From April to June and July to October, volunteers visit wetland sites once a week to count the numbers and species of migratory shorebirds that fly from Canada to Central and South America. Right now, 15-20 sites around the state are monitored, but more may be added if volunteers can be found. After looking through this lengthy list of surveys, one might also ask if they're all necessary. Responds Buhnerkempe: "Our wildlife management efforts are based on the reliable scientific and biological data we receive from these surveys. Many of them have been conducted for 30 years or more, giving us a long-term database to use in forecasting wildlife population trends. The information we receive enables us to prevent severe oscillations in wildlife numbers, which means we have healthier populations for our constituents to enjoy."
|
|||||||||||||||||||||||||
|
|