|
Home | Search | Browse | About IPO | Staff | Links |
|
Home | Search | Browse | About IPO | Staff | Links |
|
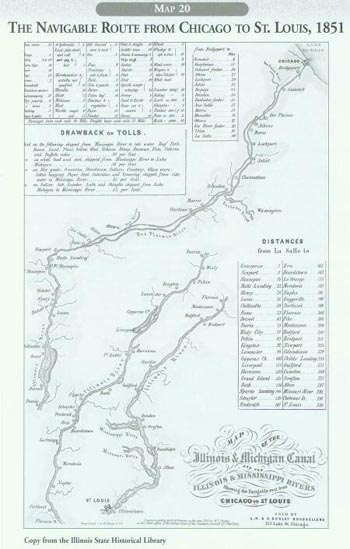
Transportation facilities were the keys to the economic development of Illinois that took the state out of the pioneer period and into the commercial economy of a mature state. Roads came first as early trails were graded, drained, provided with bridges—and even improved in some cases— by surfacing with stone or planks. But hauling commodities over roads by horse and wagon was an expensive proposition; thus most roads served local needs, often to reach water or rail transportation, which reduced costs and widened markets. Economic development in the prairie state was certainly encouraged by the navigable rivers bordering most of Illinois. And the Great Lake; reached the state in the very corner where the rivers ended. And then there was the gift of the Illinois Waterway, which offered steamboat access to the interior of the state from the very beginning of white settlement. In 1848 the completion of the Illinois and Michigan Canal, a dream of Jolliet and Marquette and a national internal improvement of first importance, provided a water passage from the Mississippi to the Great Lakes. The products of the prairie could be sent down the Mississippi to New Orleans or across the lakes and through canals, to the Hudson and St. Lawrence Rivers. Illinois wheat and salted pork could, by way of the Erie or Welland canals, join the Atlantic commercial system by way of New York or Montreal. Reading the Map This is a strip map, similar in character to Map 18, which showed the proposed route of the canal in 1830. In this case, however, only three segments are needed to indicate a longer route, all the way across the state, 54 connecting the two fastest-growing cities on the continent, St. Louis and Chicago. Indeed, this is a major point made in the title: "Map of the Illinois & Michigan Canal and the Illinois & Mississippi Rivers Showing the Navigable Route from Chicago to St. Louis." A bookseller sold the map to travelers and people who wanted to ship goods on canal packets or steamboats. Since two types of vessels would be used to make the entire journey between the major cities, two tables of distances accompany the map: from Chicago to LaSalle and from LaSalle to St. Louis. Further information on rates and tolls made this single sheet a handy pocket guide. Note that A.M. & G. Dudley, Booksellers, provide their address at the bottom of the map to guide prospective purchasers to their store. The phrase "Drawback on Tolls" needs explanation. A drawback is a commercial term for an amount paid back from a charge made. In this case it probably refers for the amount a commission agent would subtract from the selling price at a distant market to pay the tolls levied by the Canal Commission. The Illinois River beyond LaSalle was a free waterway, so no tolls are listed for the downstream leg of the Chicago-St. Louis connection. Working with the Map Students should enlarge this map about 30 percent before cutting and pasting the segments together. The enlargement will make the place names easier to read and also approximate the size of the state's official highway map. Teaching the Map The map offers lots of opportunities to develop map-reading skills, relating charts to maps, or discussing the economics of transportation costs. Tracing the course of a shipment of goods from Chicago to St. Louis will also provide ways to connect this map to others in the series. Maps 5 and 16 on the Illinois River and the Canal Route, for example, cover the same corridor. Ottawa, a canal port, appears on the 1830 manuscript map (Map 19), and Merodosia was the river port where Illinois' first railroad ended (see Map 21). Lockport, Hennepin, Peoria, Beardstown, Hardin, Alton, and Illinoistown (East St. Louis) are among the many places on this map with interesting stories to tell. Any map of the Illinois waterway (Chicago River, Illinois and Michigan Canal, Illinois River) also calls for a map of North America to show how the state became a pivot for the continent's transportation system. Be sure to relate the Erie Canal and the Welland Canal as well as the cities of Pittsburgh, St. Paul, Memphis, and New Orleans to this map. National history also intrudes on any map of this date, when the country was in the midst of sectional crisis, with the Civil War just ahead. The war brought prosperity to Chicago, a crisis to St. Louis, and encouraged the mechanization of American life. 55
56
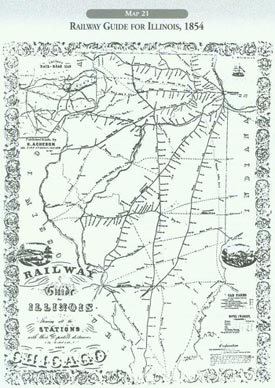
This map might be considered a companion to the sheet showing the Illinois waterway (Map 18) published just three years earlier. The Illinois River appears on both maps, but the canal connection to Chicago and Lake Michigan disappears on the railway map—one way to silence your competition. In a more charitable light, the railway map presents the railroads as a system connecting, or about to connect, all parts of Illinois with one another. It also goes beyond the state in the inset map, showing how the railroad network in 1854 extended eastward, eventually reaching the commercial centers on the Atlantic seaboard. Note how Chicago is pictured as the major connecting point between the state's railroads and the eastern lines. The fact that the map was published by H. Acheson in Chicago might have something to do with the strategic inclusion of the inset map. Reading the Map This map provides an opportunity to discuss the illustrations that mapmakers sometimes use to embellish their work. Note that a lake boat in full sail crosses Lake Michigan, sailing away from the port of Chicago. Several railroad trains send tails of smoke across the prairie. These trains seem to be heading for St. Louis, perhaps the cartographer's attempt to balance the picture after setting up Chicago as the link to the east on the inset map. In the 1850s St. Louis boomed as the great city on the Mississippi River. Many observers also thought it would become the leading railroad center of mid-America. In the Census of 1850 St. Louis was more than twice as large as Chicago, and the lake port would not catch up to its rival on the great river until 1870. The two scenes depicted on the map might provoke some discussion. The rural scene shows the railroad crossing the countryside, providing connections to other places. The other scene features the application of steam power to river transportation. St. Louis was the steamboat capital of the nation where the larger, deep-draft vessels mingled with the smaller, shallow-draft boats used on the upper Mississippi, Missouri, and Illinois rivers. Thus, when reading this map, even though the mileage figures are all from the north and it was obviously meant for a Chicago audience, note that the great metropolitan center of the region was St. Louis. Just check the way the trains are headed. Working with the Map The "Explanation" at the lower right of the map provides another key to understanding this map. It distinguishes between the three types of railroads shown on the map: those in operation, roads under construction, and those in the proposal stage. Students might make these distinctions sharper by color-coding a key and then tracing each line with the appropriate shade. Studying the names of the various lines can also be instructive. Where are the Peoria Military Tract, and the Northern Cross, Massic & Sangamon, or Wabash Valley railroads? An interesting, handwritten annotation also appears on the copy of this map in the Illinois State Historical Library (reproduced here). A traveler on the Chicago branch of the Illinois Central Railroad apparently wanted to stop at Decatur, but has penciled in a question mark above the note "Stage Line." Putting oneself in this person's shoes can trigger the imagination. Students could work with the map by using it as a document for a short story of an Illinois adventure in 1854. Teaching the Map The tables of cab fares and hotel charges in Chicago also provide some interesting ways to get students involved with the map. One passenger in the horse and buggy would be charged 25 cents per mile, but remember that Chicago at that time did not extend more than two miles in any direction from the city center. The hotels varied in price, from the deluxe Tremont ($2) to the bargain-rate French Hotel at 75 cents per night. What does a traveler expect today in a transportation map? Do the "proposed lines" on such a map have any value? What is the role of pictorial elements on maps? Are they just decorations or do they reflect some "hidden agenda" on the mapmaker's part? Remember: no map can answer all the questions it raises. 57
58
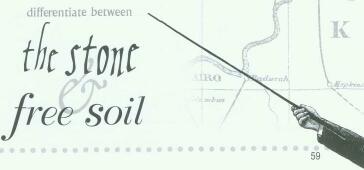
The Civil War was well underway in April 1862 when Hunt's Merchants' Magazine and Commercial Review published the map of the midwestern states from which this detail is taken. All of the Great Lakes appear on the map, as does the entire course of the Ohio and the upper Mississippi rivers. The Missouri River forms the western border, disappearing from the map above Sioux City, Iowa. The title states its purpose: "Map showing the Position of Chicago in Connection to the North West." At this very time Chicago was rapidly developing into the railroad center of the mid-continent. Its rival, St. Louis, saw its river-born commerce decline dramatically as the Great River became a battleground in place of a commercial artery. The map makes the point. Actually the article that the map accompanied was directly related to military affairs: "Harbor Defenses on Great Lakes and Rivers" by Isaac N. Arnold. The "Northwestern States" pictured on the map, contained one third of the nation's population according to the latest census. The Great Lakes and the Mississippi River system, plus the canal linking them, were simply "the most important work for either military or commercial purposes...on this continent" (page 339). The railroads on the map almost seem to overpower the navigation facilities. This was especially true "inasmuch as the rebellion has diverted to Chicago an immense trade which was formerly concentrated ... on the Mississippi River" (page 342). The map, with its emphasis on railroads, seemed to qualify the purpose of the article, which was to emphasize the need to improve defenses on the Great Lakes for fear of a Confederate alliance with Great Britain. In that event, Chicago would have immense strategic value. Reading the Map Students will easily see the two transportation systems featured on this detail from the larger document. But a few sentences from the conclusion of the article will help them read the map as a Civil War document: The Northwest is inland. No foreign territory must ever intervene between it and the mouth of the Mississippi. With one hand it clasps the East, and with the other it grasps the South, and it will hold this Union together. The Northwest believes that our nationality is worth all the blood and all the treasure which it may cost to preserve it, and she places all of her men and money at the command of the government for that purpose. To fully understand the map as a primary source, students should differentiate between slave and free-soil states on the map. They should note that Missouri and Kentucky, both slave states, were prevented from joining the Confederacy by the action of the Union army early in the war. Troops were mobilized by rail and invaded the South using both rivers and rails. Trace the route by which U. S. Grant left Galena for Cairo and then directed an invasion of Kentucky and Tennessee from Paducah.
Lincoln's journey from Springfield to Washington, D.C, after he was elected president can also be highlighted on the map, using the railroad connection in Chicago. The same route returned the body of the martyred president in 1865. Teaching the Map This is an example of journalistic cartography in which a map is used to picture or explain the content of a news article. Note that Hunt's Merchants' Magazine addressed business people rather than a general audience. Thus, it was much more specialized and technical in its approach than newspapers tended to be. Nevertheless, current newspaper or magazine maps might be compared to this example. Setting a proper stage for this map might require teachers to emphasize the fears of the North early in the Civil War that Great Britain would actively support the Southern cause. 59
60
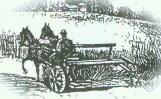
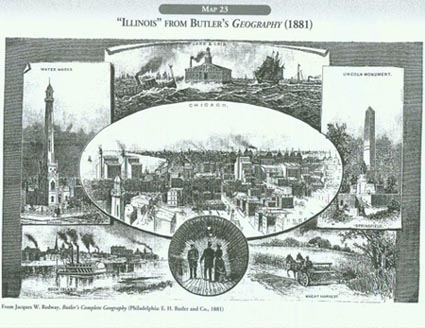
Butler's Complete Geography used many maps and pictures to bring the textbook to life. The author, Jacques W. Redway, an experienced writer, teamed up with the E. H. Butler publishing firm of Philadelphia to produce an appealing textbook for advanced students in the primary grades. Editions for particular states featured a special map and a pictorial page that showed local landmarks and typical scenes of the area. The 1881 edition for Illinois used seven scenes to define the state. One would expect that both the Mississippi River and Lake Michigan would be included in the view. Likewise, geography books for any state in 1881 would probably show a rural scene as well as the state's largest city. A view of the state capital or a reference to the state's most famous citizen could also be expected. These expectations are all fulfilled in the Illinois version of Butler's Complete Geography. Reading the Map Although the Illinois pictorial page calls for a mental map of the state to set the location for each view, the individual scenes are arranged on the page for design purposes rather than geographical correctness. Lake Michigan does appear at the top of the map, and the Mississippi is located to the west and south, just as in reality. But Chicago, as the most populous place in the state, is given the honor of the center, balanced on each side by the vertical thrust of civic monuments: one in the city, to the left, and one downstate, to the right. The wheat harvest at the lower right could be located in any county of the state. The reaper reminded viewers how the countryside was tied to the urban areas where the machinery was manufactured and the harvest was sold. The last illustration brought home a theme implicit in all the rest; people had taken control of the natural environment. In this case, a couple walks under the Chicago River by way of a street tunnel, protected by a police officer who guards the public peace. Working with the Map
Students might cut out the various scenes on the page and then locate them in appropriate places on a state highway map. Suggest that scenes labeled "Chicago" be placed on the larger-scale map of the metropolitan area included in the highway map folder. This would leave four views for the full state map, three of which have specific locations. Another way students could work with each picture would be to point out, by writing a caption, how the scene had changed from the same place a hundred years before or a century later. Teaching the Map A pictorial page such as this example severely limits the number of topics that can be included. Care must be taken in the selection of images and many things that should be included must, of necessity, be left out. Thus such leading items as a railroad train, the Ohio River, mining, and even a cornfield had to be left out of this design. Maps are simplified and distorted in similar ways. This collection of images thus might open the door to a discussion of how a graphic presentation always involves selection, omission, and the highlighting of individual topics or features. 61
62
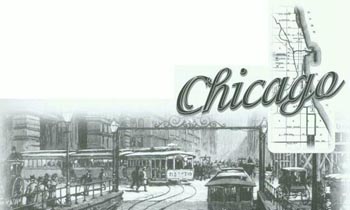
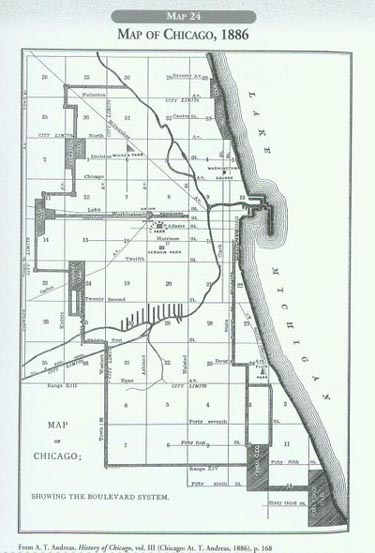
In 1880 about one-fourth of the people in Illinois lived in the Chicago area. A decade later, the proportion jumped to more than one in three. The development of commuter railroads, streetcars and a cable-car system enabled the city to expand in area even faster than it was growing in population. A modern metropolis came into view. This map, featuring the comprehensive system of parks that was emerging at the time, dates from 1886. It appeared in the third volume of a magnificent History of Chicago by A. T. Andreas. Although it pictures the largest city in the state, the map suggests a way to view any town or city in Illinois with discerning eyes. As a careful student will soon discover, the township and range system of the land survey established the basic structure of the map. This tied the Chicago area to the rest of the state in general and made the southernmost point in Illinois, at the mouth of the Ohio River, a point of reference for the grid of Chicago's plan (see Map 15). Reading the Map In 1886 the Chicago River followed its natural course and drained into Lake Michigan. Therefore the map shows us land in the Great Lakes basin rather than the Mississippi Valley. The Illinois and Michigan Canal, at the lower left, provided a link to the Mississippi Valley, but its waters were separated from those of the Chicago River by a lock and dam near Ashland Avenue. Like most maps, the water features here set the basic reference points for the map: lake, river, and canal.
The straight lines pointing in the cardinal directions all reflect the Congressional Land Survey of townships and ranges (see Map 14). Parts of six surveyor's townships appear on the map, with Western Avenue forming either the western or the eastern boundary for each one. Egan Avenue (Pershing Road) and Chicago Avenue trace the north or south boundaries of these townships. Each full township would be divided into 36 sections, each side of which was one mile long. These sections are outlined and numbered on the map, but the eastern examples are fractional townships, with some sections lost to the lake. The ranges and town (ships) are numbered along the edges so that we can designate the township that included the mouth of the Chicago River as being number 39 north of the baseline near Centralia and number 14 east of the third principal meridian, 63 which started at the mouth of the Ohio River. Many of the major streets in Chicago follow the section lines. The intersection of State Street and Madison Avenue, at the center of the central business district, marks the corner common to sections 9,10,15, and 16. The land survey lines do not dictate the course for all streets. Notice how some run on a diagonal, like Milwaukee, Ogden, or Cottage Grove avenues. These routes, off the grid, usually followed pioneer roads and Indian trails used for centuries before the surveyors arrived. Working with the Map Once again the map seems to call for color. The extensive new park system was composed of large tracts of land on the outskirts of the city. Pleasure drives, or boulevards, connected these tracts of land that supplemented the older parks that appear on the map as isolated patches scattered around the city. Coloring the parks green will emphasize how important parklands were to the expanding city. Another color should be used to trace the political boundaries of the city in 1886. Start at Lincoln Park and notice how the borders follow the section lines. The original boundaries of the city enclosed a much smaller area. In 1889 additional extensions would greatly increase the Chicago's geographical size, putting this entire area within its jurisdiction. Additional colors might be used to trace the city's system of major (arterial) streets or the six surveyor's townships indicated on the map. If water features are cast in blue, note how they have often been "improved" for commercial purposes. The harbors created at the mouth of the river, the slips in the "lumber district" along the South Branch, and the canal are all examples of internal improvements. Teaching the Map This early map of Chicago suggests ways to view old plans for any town or city in Illinois. When studying these documents, follow these hints.
1. Water features suggest the original choice of location and continue to provide a sense of place.
Many communities in Illinois started as stations along a railroad, and the line of the tracks influenced the town's character much like Lake Michigan did for Chicago. Actually the railroad pattern was very important in shaping the cityscape in Chicago in 1886. Andreas omitted the railroads from this map because they were so numerous that they might unduly complicate things and detract from the point he was trying to make about the park system. Was this a wise decision? It is hard to imagine a map of any Illinois city or town in 1886 without railroads. 64
65
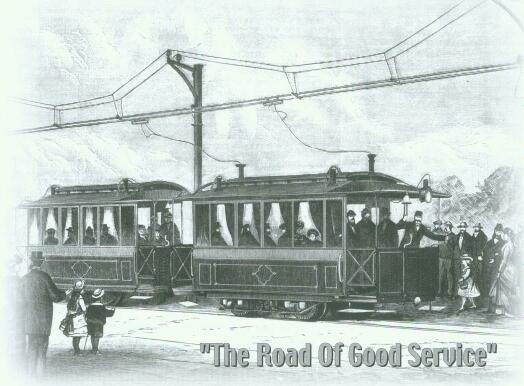
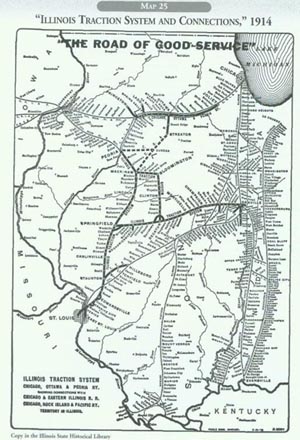
As the nineteenth century turned into the twentieth, a new type of passenger transportation was catching the public's eye. Later called "light rail," these interurbans ("between cities") used rails like the railroads but replaced heavy locomotives with light electric motors built into the passenger cars to power the trains. Electric wires strung above the tracks provided power for the trains, eliminating the need to carry coal on the train to feed the steam boilers of the engines. The result was a clean, fast, efficient way to move people, mail, and light packages between cities and towns. By 1914 many tracks had been laid down by traction companies across the United States. Indeed, it was possible to go from New York City to Chicago by these interurbans, with only one short break between tracks where one would need a cab to make the connection. Traction means the moving of a vehicle by power, and in 1914 it referred to a private business that installed tracks and wires between towns to run passenger trains on a regular schedule. Various individual routes were soon collected into systems to make traveling more convenient and provide transfer points between lines. Many of these systems assumed a statewide character, and a state map such as this one was used to inform the traveling public about the services of one particular company. Not all of the interurban lines in Illinois appear on this map. Many such tracks radiated out of Chicago. Others crossed northern, western, and southern parts of the state left blank on this advertisement for one particular line.
66 Reading the Map "The Road of Good Service" was, of course, the Illinois Traction System, which connected Peoria to Springfield and St. Louis. A branch line extended service from the state capital to Decatur, Champaign, and Danville. Other tracks connected Bloomington to the mainlines and turned Mackinaw, a small town, into a major junction. A proposed link suggested by the dotted line would funnel passengers into the Illinois Traction System from the Chicago, Ottawa, & Peoria Railway. This route apparently had been acquired by the Illinois Traction System because it appears in a bold line like the parent company. One can readily see the wisdom of this business decision and the great hopes the company had of soon being able to send passengers between Chicago and Saint Louis. The people in Mackinaw probably expected big things when this link would be completed, turning their town into a focal point for the entire system. Until these tracks were completed, passengers would need to get off the interurban at Princeton, transfer to a regular steam train of the Chicago, Rock Island, and Pacific Railroad to reach Peoria, and then switch trains once again. Passengers departing from Chicago also had to use the Rock Island trains to reach the CO & P tracks in Joliet. They could also use a competing interurban line to connect with Joliet. Following a common business practice, the Illinois Traction System's map only included lines with which the company had business agreements. This explains why the extensive system of the Chicago and Eastern Illinois Rail Road also appears on the map, with two major routes in Indiana as well. Working with the Map To provide some orientation for this map, beginning students should trace the state's boundaries and locate the Illinois River before studying the traction lines. The map also offers an opportunity to review the locations of the smaller cities of Illinois: Peoria, Springfield, Bloomington, Decatur, Danville, Rock Island, and the Quad Cities. Cities like Rockford, Alton, Quincy are more difficult to read on the map because they were not served by the traction system. The detailed list of stations on the map, however, provides a wealth of place names along the various routes. These small towns make it possible to follow the old routes on a modern highway map. For example, students might work with the map by tracing the Illinois Traction route from East St. Louis to Peoria on today's road map. Teaching the Map For advanced students this example provides excellent opportunities to discuss the limitations of maps: how they select, omit, and distort reality as they address a particular purpose. Considering why a map was made is often a good place to begin an analysis of its content. Beginning students can use the map to practice way-finding and to appreciate the differences between traveling in the railroad era and in today's automobile society. Some senior citizens might have memories of riding the interurbans. The Illinois Traction Company operated trains until 1956. James David Johnson has compiled a book on the system, The Lincoln Land Traction (Wheaton, III: Traction Orange, 1965). The nation's last interurban line still connects Chicago with Indiana towns. The Chicago, South Shore, and South Bend Railroad, with a schedule that still operates every day, offers rail fans an opportunity to relive the golden age of the light rail systems. 67
68
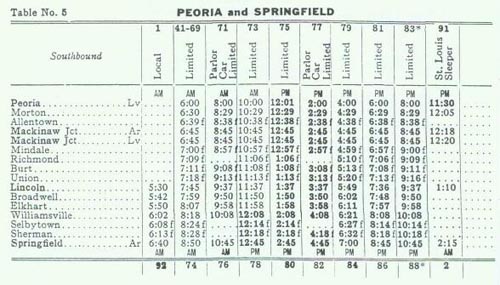
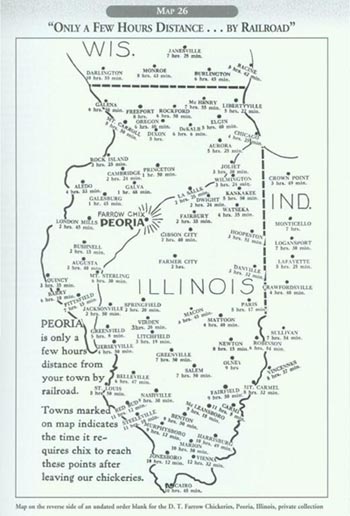
Although this map dates from the 1920s, it could be considered a companion to the interurban system featured on Map 25. But this is a special railroad map: it does not show any tracks! Instead, it celebrates the way rails have tied the state together so that almost any point in the state can be reached in less than half of a day. The times between shipping from Peoria and arrival at the town of choice are all listed on the map. Thus the map features time measurements, not geographical distances. The map appeared in the 1920s on the reverse side of an order blank for D. T. Farrow Chickeries located in Peoria. This company hatched chickens and sent the hatchlings by rail to farmers (and some suburbanites and town-dwellers as well) throughout Illinois. More than a day in transit would pose severe health problems for the chicks, but the modern transportation system largely eliminated this problem. The order blank offered eight breeds of chicks for sale, from White Leghorns to Minorcas and requested customers to fill in the date on which the chicks should arrive. The firm also asked its customers to indicate the newspaper in which they saw the Farrow advertisement that prompted the order. The chicks could be sent by way of a railroad express company or through the U.S. mail. In sum, the map and the order blank indicate how the transportation and the communication systems of a society relate to each other. Reading the Map The state of Illinois is the main subject of this map, but the coverage extends into southern Wisconsin and western Indiana as well. The boundaries of the Prairie State are prominently displayed on the sheet, and the Illinois River is given to provide a geographical reference across the state. All the other data on the map are towns with the time it takes for a train leaving Peoria to arrive at the designated location. Peoria is printed in bold type to emphasize its central location in Illinois. It was obviously an advantageous place from which to market chicks in Illinois. The firm's name accompanies Peoria's label to underscore the point, Note that the lines that radiate out from the town to make it sparkle like a gemstone. The text at the lower left reiterates the point in a simple sentence and then explains the meaning of the time measure on the map. Working with the Map An isobar is a line on a weather map connecting points of the same barometric pressure. A similar isoline can be drawn on this map to enclose all the places listed that can be reached in two hours or less. Ask students to use a pencil and draw such a line on the map that would include all the stations that are less than two hours from Peoria. Some erasing and redrawing will probably be necessary. Color this line green. Next use a blue line to enclose all the stations between two and four hours distant. Then color this "iso-chick" blue. Finally use red and brown for similar lines at six- and 69 eight-hour intervals. Teaching the Map The Illinois Traction System made express service available on all of its trains. Students could therefore use Map 25 to draw the route on the Farrow Chickeries map between Peoria and Springfield. Using the timetable below (from 1914), ask individuals to determine which train the Farrow employees would use to get an order of chicks to Springfield for pick-up at 9 a.m., 1 p.m., and 7 p.m.
70
71 |
|
|