|
Home | Search | Browse | About IPO | Staff | Links |
|
Home | Search | Browse | About IPO | Staff | Links |
|
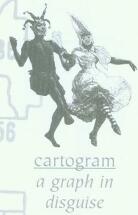
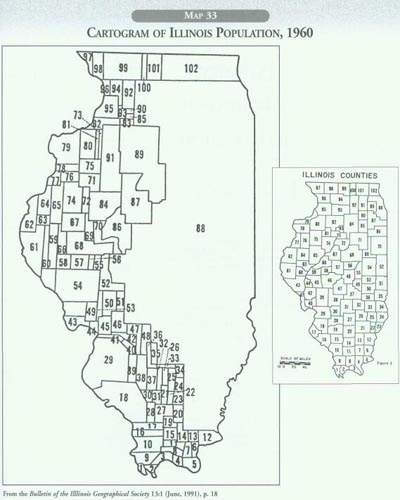
A cartogram looks like a map, but it is really a graph in cartographic disguise. Instead of reproducing the surface of the earth according to a certain scale and projection, a cartogram takes a set of statistics, like the population of Illinois in 1960, and makes a square of a certain size to represent the total. Like a pie graph, the square equals 100 per cent. Then the designer divides the square into 100 or 1000, equal pieces. These pieces, each representing one percent or one-tenth of a percent, are then cut out and arranged to look like a map. The results can be very striking. Thus the key to any cartogram is to recognize the similarity of the graph to a comparable map. At the same time, one must note its differences. It is this combination of similarities and differences that gives cartograms their visual power. Reading the Map In this example each county's population on the cartogram is turned into a percentage of the state's population. This percentage, expressed as a group of small one-tenth percent squares, is arranged in a way that resembles the geographic shape of the county and then set in a convincing place on the designer's map-like graph. In this example the graph-maker started with the largest county and fashioned its units in such a way that it outlined the eastern border of Illinois. Next, other populous counties were also given shapes to complete most of the Illinois boundaries. In the final step, a host of smaller counties were fitted into the remaining spaces. Since most of the state's counties were too small to identify by name on the cartogram, each one was assigned a number. The key to these identifications is the accompanying map, which also numbers the counties in their geographical location and with their actual shape. The cartogram accurately outlines the shape of Illinois and divides its area into percentages rather than geographical units, relying on the reader to compare it to the map, perceiving its similarities and differences. Working with the Map Students will first want to locate their home county and compare its location on the cartogram to an actual map. Perhaps this county should be named and highlighted on both images. Next, students should also color and identify the following counties, the state's ten largest in 1960 in terms of population:
88 - Cook These images are also good devices to emphasize the dominant place of urban areas in Illinois. All of the counties in Chicago's metropolitan region should be shaded in one color, and those in the St. Louis area in another. The Chicago group would include Lake, McHenry, Cook, DuPage, Kane, and Will counties. The metropolitan area of St. Louis includes Madison and St. Clair counties in Illinois. Note that Sangamon County, number 46, where the state capital is located, did not have a high population density in 1960. Teaching the Map Neither the cartogram nor the map have any place names. A reference, which labels the counties of Illinois, such as a state highway map, will be needed when students work with this map. It would also be a good idea to show them other examples of cartograms such as the standard collection in The State of the World Atlas, currently edited by Dan Smith. (A new edition is prepared every few years. The current one is a Penguin Reference paperback). 88
89
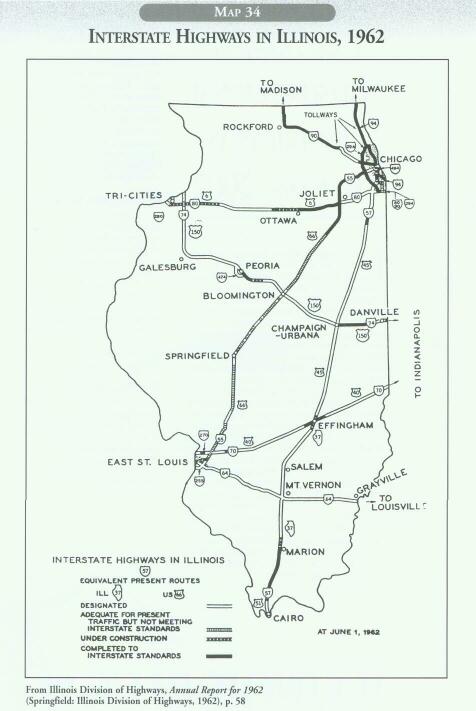
The federal government developed a major interest in highways during World War I when their value to national defense became very apparent. After the war, General John J. Pershing led a committee for the Bureau of Public Roads to designate certain routes as defense highways. The "Pershing Map" of 1922 proposed a 78,000-mile system of U.S. routes, and Congress appropriated funds for states to improve these highways. The U.S. routes were numbered, marked, and gradually improved. In Europe, however, especially in Italy and Germany new types of highways designed for high-speed travel were being constructed in the 1920s. These superhighways had limited access points, grade separations when crossing other roads, greenways for median strips, and cloverleaf interchanges. Highway departments wanted to build some of these expressways in the United States, but the economic restrictions of the Great Depression in the 1930s followed by World War II in the next decade, postponed most of their plans. In 1956 President Dwight D. Eisenhower, a military leader in the late war, proposed a national system of defense superhighways to connect all the major cities in the forty-eight states. These would be used by the armed forces in case of war or a national emergency. Congress accepted his proposal and created a National Highway Trust Fund to help states build and maintain these expensive new roads. The exact routes were largely left up to the states to decide and locating the interstates became major political issues. Areas with the most political clout had the best chance of being served first with new highways. Reading the Map This map, showing the status of the Interstate Highways in Illinois on June 1,1962, appeared in The Annual Report of the Illinois Division of Highways. It shows the routes completed to the standards for these highspeed roads and those portions then under construction. By 1962 the original system was largely completed in the northeastern corner of the state where most of the people lived. But the funds for many of these roads were to come from tolls paid by those who used them. Note the tollways marked on the map. The heavily used U.S. Route 66 was to be replaced by Interstate 55, but the highway engineers decided that the old roadway was still adequate in many places so that the new construction could be phased in over the next decade. Other segments of the system existed only in the proposal stage in 1962 and these would enter the construction phase only when funds became available. In the meantime, existing state and federal roads would serve as substitutes for the interstates. Over the decades the system was completed and even expanded by adding additional superhighways. Sometimes these were designated interstate routes, but in other cases they were numbered as Illinois or U.S. highways. Working with the Map Every map raises questions. Why are certain towns labeled on the map while much larger places are left off? Ottawa, the old canal port, perhaps appears for historical reasons or to mark the end of new construction. What explanations could be offered for the inclusion of Salem and Grayville while small cities like Decatur, Alton, and Quincy are omitted? Teaching the Map One way for students to grasp the pattern of the highways on this map would be relate it to the interstate system as a whole. But, since state officials designated the actual routes, a state-by-state analysis has some logic as well. This map, for example, shows two north-south routes in Illinois, four that cross the state east and west, plus two that follow the curve of Lake Michigan's shoreline. Suggest local names for each of these routes that would reveal their intra-state character. Remind students that "inter" means "between" and "intra" means "within." Then suggest some examples as "Lake Shore Drive" for 1-94 or "Main Street of the Midwest" for 1-55. 90
91 Pages 92- 96 have been omitted from this online version of Illinois Histroy Teacher.
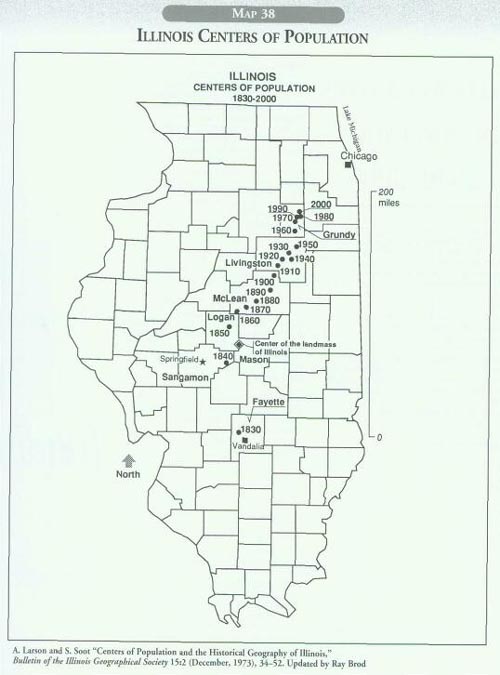
Centrality is a very important concept in both geography and cartography. It is also a significant concept in history. To be in the middle of things is to gain an important advantage. Most cultures, from Native Americans living in Illinois in early times up to our own society today, have conceived the universe with their place in the center. Thus, it should come as no surprise that scholars have been interested in where the center of things falls in Illinois. This example first appeared in the Bulletin of the Illinois Geographical Society in 1973. Professors Al Larson and Siim Soot provided a sequence of maps showing population change in Illinois, county by county, from 1830 to 1970. This map summarized their data by using the concept of centrality. Ray Brod has updated it to 2000. Reading the Map Begin by noting that this is a very simple political map, dividing the state into counties but providing no additional geographical references. Some counties are named on the map—those with some connection to the discussion in the article. Then a series of dots accompanied by dates snakes its way across the map. One final detail is a dot in a circle on the boundary between Logan and Mason counties. This center of the landmass of Illinois provides a good introduction to the concept of centrality in general and to the map in particular. If you would take a piece of plywood, cut it to outline the state of Illinois, and then drive a nail into its center so that you could balance the heavy sheet on the nail, you would have located the center of the state's land mass. The point on the map, of course, is only an approximation, generated by calculations rather than sawing up some plywood. But its location is very striking, almost dead center on the third principal meridian, which was determined by the mouth of the Ohio River. This is the most important line in Illinois for determining land ownership, and it also sets the boundaries for more than a dozen counties. Indeed you can trace the meridian on the map by placing a ruler at the mouth of the Ohio River and watching the county lines fall into place. The center of population of a state is much more difficult to picture. Go back to our sheet of plywood so we can mark all the counties on the map. Then put weights in each county's area equal in number to its population, say one weight for every 12,500 people (or about .1% of the total population of 12,482,301 according to the census in 2000). Now when this contraption balances on the today's center of population will be discovered. In 1830, when the i state was only a dozen years old, this center was also on the third principal meridian near Vandalia, which was then the capital of the state. Working with the Map
Start with the Vandalia point that marked the center of population in 1830, at least as far as U.S. citizens were concerned. The Indians still living in Illinois were not counted in the census and thus do not appear as weights on "the plywood map" for 1830. Now draw a line from Vandalia to the 1840 point in Sangamon County. Note how the population of the state shifted markedly to the north and a bit to the west. It was probably no accident that the state capital followed the people and moved to Springfield, in Sangamon County, in 1839. In that year thousands of Mormons arrived in Illinois. They settled along the banks of the Mississippi River in Hancock County during the 1840 census, tugging the center of population westward. In the 1840s, however, Chicago started to pull the state's center of population toward Lake Michigan, a force that let up only in the Great Depression of the 1930s when people left the urban area and returned to the farms. Connecting the various centers of population in chronological order will show the strength of Chicago's pull over the decades. Teaching the Map In several ways this map offers teachers a chance to summarize the history and geography of the state. Its broad chronological reach makes it an excellent companion for a time line covering the state's history. At the same time it can serve as an outline map because it provides space for students to fill in key geographical information such as major rivers, important cities and towns, historic sites, natural features, and state parks. As students add to the map they can give it a new title as well, making the centers of population only one item in the key to an expanded map. 97
If a map appears as the first item on the list for a scavenger hunt, chances are that most teams will return with a state highway map folded into the familiar "glove compartment" size, about 4-by-9 inches. Almost every automobile, if not every home, has at least one of these common cultural artifacts. They obviously serve a variety of needs in modern American society. That utility, along with their widespread distribution, gives them certain advantages when used as curriculum materials. How might a current highway map of Illinois be used in our classrooms? A variety of approaches and levels of analysis come to mind, but they all start with some basic practice in map reading. The map might serve as a culminating activity, turning the class period into a laboratory session as the students draw on previous map lessons, relating various topics to each other, constructing mental pictures of the landscape, and noting how imprints from the past keep popping up on today's maps. If this exploration were structured according to the five themes of geography—location, place, region, movement, and human-environment interaction—the activity would have high transfer value. That activity is commonly used in geography classes. The following outline was designed to serve as a guide to any Illinois highway map, whether from the state itself or from a commercial publisher. The map of the entire state usually takes up the whole sheet, measuring about two feet by three feet. The margins and the reverse side are used for a map index, information on points of interest and the state parks, and small maps of the state's various cities and metropolitan areas, including a larger one of Chicago and vicinity with an inset featuring Central Chicago. In the following outline for reading the map, students should use both the state map and the two maps for the Chicago metropolitan area. 99 Please note Students need to obtain a state highway map to use in conjunction with this outline. Working with the Map I. Starting With Location A. Longitude and Latitude II. Thinking About Place A. Names: Illinois and Chicago III. Envisioning Regions A. Watersheds1. Great Lakes-St. LawrenceB. Ecosystem Frontiers IV. Marking Transportation Notes A. Water1. Lake (Great Lakes Naval Training Center)B. Roads V. Considering Some Human-Environmental Interactions A. Roads 100 Teaching the Map
Start by directing students to the key, which explains the meaning of the symbols used on the map. Practice reading the map by locating places where the various symbols are employed. Try to envision these locations in the actual landscape. The five themes of geography (location, place, region, movement, and human-environmental interaction) provide good starters for developing a set of questions to ask about the map and the land it portrays. As you study the map, search for nodes of activity or places of influence. Looking for differences and distinctions on a map will naturally lead to considerations of hierarchy, regions, boundaries, and exchange. Ask where transitions from one locality to another might occur. Most highway maps use text, pictures, charts, and a variety of graphic devices in addition to the featured map to present the place in a certain light. Ease of travel, the delight of a visit, and words of welcome have become standard messages on official state highway maps. Teachers can take advantage of these elaborations, asking students to write appropriate texts, captions, and information for visitors as well as incorporating pictorial materials and redesigning the package that envelopes the map. Taking an inventory of the different parts of a highway map is a useful way to conclude a lesson. Noting the relationships between the elements might naturally lead to a discussion evaluating the effectiveness of the map and its package as a whole.
101 |
|
|

 98
98