|
Home | Search | Browse | About IPO | Staff | Links |
|
Home | Search | Browse | About IPO | Staff | Links |
 50 I l l i n o i s P a r k s & R e c r e a t i o n www.ILipra.org  www.ILparks.org S e p t e m b e r / O c t o b e r 2008 51 Does Form Influence Outcome? In 2008, to discover whether different structures of government correlated with particular levels of green space set aside for communities or with park amenities and programs, researchers from the George Williams College of Aurora University conducted a study of parks and recreation agencies in Illinois, Indiana, Ohio, Michigan, Wisconsin, Iowa and Missouri. In total, 951 public park and recreation agencies available from the Census of Governments in the afore-mentioned states were sent a questionnaire. A total of 261 agencies responded, a 27.4 percent response rate. Agencies were asked their populations, numbers of parks, total acreage and total park amenities. Among other questions, agencies were also asked how much autonomy administrators and their boards were provided in determining total operating and capital expenditures.
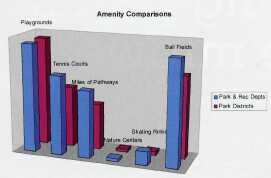
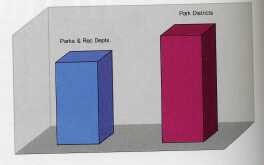
Comparing Parks and Amenities The data showed similarities and differences between the number of parks and acres per thousand provided by park districts compared to municipal parks and recreation departments. Respondent parks and recreation departments and park districts in the Midwest provided nearly an equal average of acres per thousand, 20.13 acres per thousand for municipal parks and recreation departments and 19.088 acres for park districts. In addition, responding municipal parks and recreation departments in the Midwest averaged 1.20 park sites per thousand people, while park districts provided .78 parks per thousand. Because the average acreage of both types of agencies was shown to be nearly the same, the finding that parks and recreation departments provide more sites suggests that they provide more numerous neighborhood parks to their communities than park districts, while park districts focus more on larger community and regional parks. Comparing traditional park amenities, such as playgrounds, tennis courts, pathways, nature centers, outdoor skating rinks and Softball or baseball fields, the 2008 Midwest study identified differences in the average number of amenities provided by municipal park and recreation departments compared to park districts. Amenity comparisons were controlled for population. Likewise, park and recreation departments and park districts were shown to average nearly the same number of nature centers, about one for every 55,000 people. But, on average, responding park and recreation departments provided more tennis courts than park districts, about one for every 2,065 people compared to one for every 2,700 people. Park and recreation departments also provided more pathways, an average of one mile of pathway for every 2,460 people compared to one mile of pathway for every 3,580 people served by a park district. Municipal agencies provided more skating rinks (one per 12,300 people) compared to park districts (one for every 40,300 people) and more ball fields (one for every 1,570 people) compared to park districts (one for every 2,000 people). The findings do not take into consideration the quality of the parks or amenities because there is not an economical way of measuring those variables. But the findings are clear that park districts as a structure of government are not superior to municipal parks and recreation departments in providing parks and amenities.
Questions Raised by the Study There are two anomalies in the findings that park districts are not superior to municipal parks and recreation departments in providing parks and amenities. One involves the recent finding of the University of Illinois study that public perception in Illinois is that parks and recreation services would best be provided by park districts instead of by municipal departments (see Illinois Parks & Recreation, July-August 2008, pages 12-17). The other is that Illinois park districts have won nearly 40 percent of the Gold Medal Awards for Excellence in Parks and Recreation Management and this year comprise nine of the 20 finalists in the five population categories. A possible explanation of why the Illinois public perceives park districts to be a superior service delivery system could be that the winning of so many Gold Medal Awards by Illinois park districts contributes to the public perception that park districts are better. But an explanation still needs to be made about why park districts win the awards so often. Comparing Recreation Programs One possible explanation found in the data is that park districts provide more recreation programs than do park and recreation departments. 52 I l l i n o i s P a r k s & R e c r e a t i o n www.ILipra.org  www.ILparks.org S e p t e m b e r / O c t o b e r 2008 53 The 2008 Midwest study shows that, on average, park districts provide 30 percent more recreation programs than do park and recreation departments. Since a major criterion for the Gold Medal Award is the provision of recreation programs, it makes sense that park districts would win more awards. Which raises another question: Why would park districts operate more programs than park and recreation departments? One explanation might be that they have more administrative autonomy. Comparing Administrative Autonomy In 2002 and 2005, studies were conducted in Illinois and Wisconsin that showed that park district administrators reported a level of autonomy that was 36.2 percent higher than their counterparts at municipal agencies. (See "Autonomy, Professional Training and Revenues", May/June 2007 Illinois Parks & Recreation.) These findings were affirmed in the 2008 Midwest study, which showed higher levels of administrative autonomy for park districts compared to parks and recreation departments.
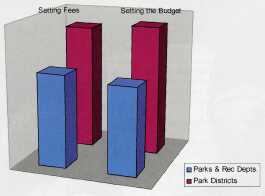
Aurora University's 2008 Midwest study showed that the administrative autonomy that park district administrators and boards felt they had to set operating budgets and fees exceeded that of municipal park and recreation department administrators and boards, even when data collection efforts were expanded to more Midwestern states than had participated in the earlier studies. The 2008 Midwest study showed that park districts had nearly 50 percent more autonomy to set fees and operating budgets, an even greater difference than the 2002 and 2005 studies. The Question of Capital Autonomy vs. Operating Autonomy The 2008 Midwest study suggests that, when the database is expanded to include more Midwestern states, park districts actually perform less well compared to parks and recreation departments in terms of facilities, even though they perform better in terms of programs. In the 2002 study limited to Illinois agencies, park districts and park and recreation departments provided the same number of parks and amenities. But when the data collection was expanded to more Midwestern states, the municipal agencies that participated in the survey offered, on aggregate, more amenities than did the park districts. Considering that parks and facilities are funded differently in most Midwestern states than in Illinois, the differences are understandable. In Illinois, where properly taxes are capped, referenda are required to raise them. In other Midwestern states, many of which also cap property taxes for operating budgets, the states do not require municipalities to hold referenda to raise property taxes to fund capital expenditures. Therefore, autonomy cuts both ways. Park districts appear to have the autonomy to operate whatever recreation programs they see fit. But park and recreation departments in other states appear to have the autonomy to build recreation facilities. Clearly, more study needs to be done if we are to understand how the process works. But what we do have is evidence to support the idea that autonomy in the hands of park districts leads to excellence in park and recreation program management, what the Gold Medal Award ultimately recognizes. But we also are learning that tax caps in Illinois are suppressing the number of parks and amenities that park districts are allowed to provide. Further Details on the Web At the IAPD Web Site (www.ILparks.org) ... At the IPRA Web Site... David N. Emanuelson Ph.D., is an assistant professor of recreation administration and the graduate internship coordinator at the George Williams College of Aurora University. He has 30 years administrative experience serving as a park and recreation department head in Illinois and Indiana and as an Illinois park district director, with his park district winning a Gold Medal Award in 2003. You can e-mail him at demanuel@aurora.edu. 54 I l l i n o i s P a r k s & R e c r e a t i o n www.ILipra.org |Home|
|Search|
|Back to Periodicals Available|
|Table of Contents|
|Back to Illinois Parks & Recreation 2008|
|