By PETER W. COLBY and PAUL MICHAEL GREEN
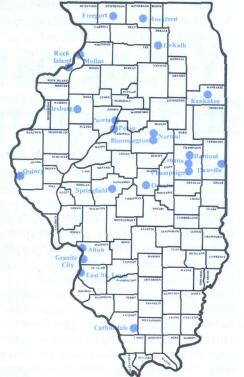
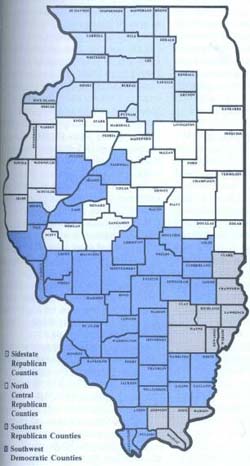
Sidestate, Southwest, North Central, Southeast Voting patterns in the 96 Downstate counties JIMMY CARTER carried the city of Chicago by 425,000 votes in 1976. Gerald R. Ford won the 5 1/2-county Chicago suburban area by almost exactly the same margin, 425,000. It was Ford's 93,000-vote plurality in the 96 Downstate counties that provided him with a statewide victory. The pattern of voting in the Ford-Carter contest was not a numerical accident. In an earlier Illinois Issues article ("Downstate holds the key to victory," February 1978), we presented the demographic shifts and electoral trends since 1932 which have resulted in a virtual balance between Democratic Chicago and its Republican suburbs. Thus, in any close election, the 96 Downstate counties hold the key to victory. As table 1 reveals, the 96 Downstate counties much more closely reflect statewide voting than do Democratic Chicago or the Republican Suburbs (suburban Cook, DuPage, Kane, Lake, Me Henry and Will counties). For too long, professors, politicians and pundits have labeled all of Illinois beyond Cook County as "Downstate" and analyzed elections in terms of Democratic Cook County versus 101 Republican Downstate counties. Even the more limited view of Downstate as comprising 96 counties is still too broad for a useful understanding of Illinois politics. In fact, there are many different "Downstates." For example, more than distance separates Carroll County in Northwest Illinois from Gallatin County in the Southeastern part of the state. Only twice since 1932 have the voters in these two "Downstate" counties supported the same presidential candidate and not once since 1932 have they voted the same way for an Illinois governor. This extreme case demonstrates the need for a closer look at Downstate voting. The 'Other 96' Based on 1970 census figures, the population of the Other 96 is 4,135,029, or 37.2 per cent of the state's 11,109,935 total. Only 11 of these 96 counties had populations over 100,000; 16 had populations under 10,000. Over 50 per cent of the total Downstate residents live in just 13 of the 96 counties. St. Clair County, with 285,176 people, is the largest and Pope County, numbering only 3,857, is the smallest. Urban centers are scattered throughout the Other 96 (see figure 1). Rockford in Winnebago County and Peoria in Peoria County have populations over 100,000. Six population centers — East St. Louis (St. Clair), Springfield (Sangamon), Decatur (Macon), Champaign-Urbana (Champaign), Bloomington-Normal (McLean) and Rock Island-Moline (Rock Island) have populations in the 50,000-100,000 range. There are 11 other cities with populations between 25,000 and 50,000 located mainly throughout the northern half of the state. Figure 2 offers a general geographical introduction to Downstate. First, note that 16 counties lie west of Cook and the Collar counties. These "Sidestate" counties comprise a large part of the strongest Republican area in the state. Except for Rock Island (71 per cent) and LaSalle (38 per cent) counties, since 1932 not one of the Sidestate 16 has been carried by more than 30 per cent of Democratic presidential or gubernatorial candidates. In fact, since 1932, 6 of the 15 counties have never voted for a Democratic presidential or gubernatorial candidate; 3 others have been carried only once by a Democrat. A second identifiable group of counties is centered in Southwestern Illinois in Madison and St. Clair counties in the St. Louis area. Within the 40-county area labeled "Southwestern Illinois" on
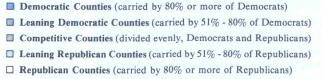
PETER W. COLBY August 1978/Illinois Issues/15 figure 2, there are 37 counties which have supported Democratic presidential and gubernatorial candidates in nine or more of the 24 races since 1932. Outside this 40-county bloc, only two of the remaining 56 counties have followed similar patterns. Excluding the Southwestern 40-county area and the Sidestate 16-county region there remain 28 "North Central" counties and 12 "Southeastern" counties which have backed Republicans at least 60 per cent of the time since 1932. Careful scrutiny of the 24 election contests for president and governor since 1932 underlines the basic theme of Democratic Southwest Downstate versus Republican North and East Downstate (see figure 3). From 1932 to 1976 seven counties voted for Democratic presidential and gubernatorial candidates over 80 per cent of the time. All seven are within the 40-county bloc in Southwestern Illinois. The population of these top Democratic counties is 787,372, or 19 per cent of the people living in the Other 96. Twelve other counties voted Democratic at least 60 per cent of the time for president and governor. Except for Rock Island County all of these counties are located in Southern Illinois — or along the Illinois River south of Peoria County. The population in these 12 counties adds up to only 479,806 or 12 per cent of the Downstate total.
During this 44-year period six counties gave Democratic presidential and gubernatorial contenders a plurality exactly 50 per cent of the time. Like the strong Democratic counties, these six counties are all located in Southern Illinois and have a population of 135,994 or 3 per cent of the Other 96 total. The remaining 71 counties, containing 2,731,857 people or 66 per cent of the Downstate total, have voted Democratic less than 50 per cent of the time for president and governor. The figures reveal the substantial Republican strength in Northern Illinois. Thirty of these 71 counties have voted less than 20 per cent of the time for Democratic presidential or gubernatorial candidates. In fact, in nine of these counties no Democratic candidate has won since 1932. Not surprisingly, two-thirds of these nine counties are located in Sidestate Illinois. The remaining three are located in far Southeastern Illinois (Johnson, Pope, Edwards) where Republicans have always run well. Separating the presidential and gubernatorial results, it may be seen that only 16 of the Other 96 counties have supported Democratic presidential candidates a majority of the time since 1932. With the exception of Rock Island County, the remaining 15 counties are on a line with or south of Sangamon County (Springfield) in the 40-county Democratic bloc. On the other hand, in gubernatorial races the Democratic candidates have done better in the Other 96 than their presidential counterparts. Democratic gubernatorial candidates have carried 26 counties of the 96 a majority of the time. As in the presidential contests most of the Democratic counties lie in the southern half of Illinois. Unlike the presidential results, however, a string of Illinois River counties south of Peoria (Tazewell, Mason, and Cass) have consistently supported Democratic gubernatorial candidates. Tazewell County, southeast of Peoria, deserves special mention for its unique gubernatorial voting record. Since 1932 Tazewell supported only half of the Democratic presidential candidates but at the same time it carried for 11 of 12 Democratic gubernatorial candidates. In 1976, James R. Thompson broke the string of Democratic victories when he beat Michael J. Hewlett by 22,000 votes (29 per cent).
Democratic Southwest Writing in 1960, Professor Austin Ranney, a noted political scientist, said that in Illinois "a statewide election is a contest between Republican downstate and Democratic Cook County in which the Democrats need at least 58 per cent of the Cook County vote if they are to win the state" (Illinois Politics, N.Y. Univ. Press, p. 52). Ranney, of course, saw the five Collar counties as part of Downstate, but his main message was that Cook County was the Democratic bastion in Illinois. In raw vote totals there is no doubt that Cook County, with nearly 50 per cent of the state's total population, plays a dominant role in Illinois politics. However, the general belief that it is the best Democratic county in the state by percentages is historically untrue. St. Clair County has consistently given Democratic candidates a higher vote percentage than Cook County. Only once since 1900 has Cook County given a Democratic presidential candidate a larger percentage vote than St. Clair County (Hubert H. Humphrey in 1968 received 50.6 per cent in Cook and 50.3 per cent in St. Clair). Moreover, since 1932 Republican presidential candidates have carried Cook County three times (1952, 1956, 1972) while George S. McGovern in 1972 has been the only Democratic candidate to lose St. Clair County. Not only has St. Clair been more Democratic than Cook County but historically it has been more Democratic than the city of Chicago. If one totals all the presidential contests from 1900 to 1976, the results show that St. Clair County's Democratic presidential 16/August 1978/Illinois Issues percentage has been higher than Chicago's in 15 of 20 races. Only recently has Chicago given Democratic presidential candidates a consistently higher percentage than St. Clair County. St. Clair County contains the Democratic stronghold of East St. Louis which has a large black population. With 63,408 black residents, it has the largest black population in the Downstate 96, and its black population is four times greater than runner-up Winnebago County. St. Clair County's Democratic tradition, however, like that of many other Southwestern Illinois counties, goes back to the days of William Jennings Bryan, whose family and professorial roots were in Southwestern Illinois, although his home state was Nebraska. He was born in Marion County, went to college and practiced law in Jacksonville (Morgan County) and married a girl from a prominent Pike County family. Bryan's populist views appealed to hard-pressed southern downstaters, and for many years his supporters battled Chicago Democrats for control of the Illinois Democratic party. Another factor contributing to the strength of the Democratic party in Southern Illinois has been the state's traditional migration patterns. According to David Kenney, "sectionalism [southern Illinois vs. northern Illinois] had been formed out of the two distinct streams of emigration into early Illinois
August 1978 /Illinois Issues/17
— on the one hand from such southern states as Kentucky, Tennessee and Virginia, and on the other hand from New England, New York and Pennsylvania" (Basic Illinois Governments, SIU Press, 1970, p. 73). The former settled in Southern Illinois while the latter migrated to the Northern part of the state. The Civil War produced several strong Democratic counties in Southern Illinois while it fostered Republican growth in Northern Illinois. In many ways Cook County's leading role in Illinois politics through the rapid growth of Chicago and (later) the suburbs and Collar counties was an aberration. Chicago's northern location, strong industrial base and the new residents it attracted from other northern states should have made Cook County a powerful Republican fortress in the post-Civil War period. But the immigration to Chicago of immense numbers of European Catholics and Jews, the trade union movement and the awakening of "urban power" (symbolized by Franklin D. Roosevelt nationally and Anton Cermak in Chicago) made Cook County (along with Rock Island County) a Democratic oasis in Northern Illinois.
Breakdown by decades Professor V. O. Key once described a critical election as one in which the depth and intensity of involvement are high, in which more or less profound readjustments occur in the relations of power within the community, and in which new and durable electoral groupings are formed (Journal of Politics, 17, 1955, p. 1-18). This distinguished scholar and several of his disciples have labeled 1932 as just such an election in American history. Although their theory is generally sound, it does not explain the long-range voting trends of the Other 96 counties in Illinois. In 1932 and 1936 Democrats Franklin D. Roosevelt and gubernatorial candidate Henry Horner trounced their Republican opponents in Illinois. FDR received 55.2 percent of the vote in 1932 and 57.7 per cent in 1936; Horner tallied 57.6 per cent and 53.1 per cent, respectively. Both men carried an overwhelming majority of the 96 Downstate counties. But in 1936 FDR lost 28 Downstate counties including 13 he lost four years earlier. He picked up Winnebago and Peoria counties which contained the largest Downstate cities, Rockford and Peoria. Roosevelt's urban appeal was great in 1932, but it diminished in later elections. For only in the 1964 Lyndon B. Johnson landslide did Winnebago again vote for a Democratic presidential candidate. Peoria County supported FDR in 1940 but did not support another Democrat until Johnson in 1964 — and none since. The three election battles in the 1940's show a reversal of the fortunes of the Democratic party in the Other 96 counties. The presidential candidates were victorious because of a large Cook County plurality. But Republican Dwight H. Green, a Chicagoan who ran for mayor in 1939, managed to carry Cook County in 1940 and hold down Thomas Courtney's Cook County margins in 1944 to win the governor's mansion twice. Then, in 1948, Adlai E. Stevenson II with powerful Downstate support coupled with equally strong support in Cook County, demolished Green's quest for a third term. The 1950's were the best of recent times for Illinois Republicans. Dwight D. Eisenhower trounced Stevenson twice, outpolled him in Chicago in 1956, and nearly blitzed him both times Downstate. The gubernatorial contests were much closer: Republican William G. Stratton's 1956 winning percentage was 50.3 per cent to Richard B. Austin's 49.5 per cent. Obviously, the 1930's Roosevelt-Horner revolution had been reversed Downstate leaving the "critical election" theory in need of modification. Duncan McCrae and James Meldrum's article, "Critical Elections in Illinois 1888-1958," solves part of the puzzle. They wrote, "If we compare 1926 with 1956 . . . , it is clear that nearly the same proportion of the vote was Democratic in these two years, but that the sources of the Democratic and Republican volts had changed. It is generally believed that the Democratic vote became more urban. Catholic, and wet, while the Republican vote became more rural. Protestant, and dry" (Am. Pol. Sc. Rev., 54, 1960, p. 674). Since Downstate was less urban, less Catholic and less wet than Chicago and Cook County, the Democratic vote became more identified with the Northeastern part of the state. Other factors also gave Chicago a higher percentage of the Democratic vote. Negroes had previously been the staunchest Republican voters in Chicago, giving GOP candidates like Mayor William Hale "Big Bill" Thompson enormous pluralities. FDR, the depression, a few shrewd Chicago Democratic leaders and turncoat black Republican William L. Dawson converted them in the 1930's. Dawson became Democratic "Boss" of the South Side black wards and served in the U.S. Congress for nearly 30 years. By the 1950's blacks were the fastest growing ethnic group in Chicago and provided a good chunk of the Illinois Democrat vote. In 1955 a product of the Chicago Democratic organization was elected mayor of the city. Richard J. Daley quickly became Mr. Democrat in Illinois; His power, position and personality dominated most state campaigns, and he gave the Illinois Democratic party a strong Chicago flavor. The critical elections in the 1930's, Chicago's growing black population and Mayor Daley made it tougher for rural, Protestant, dry downstaters to identify with the Illinois Democratic party. Daniel Moynihan once wrote, "The era of the Irish politician culminated in [John] Kennedy .... That moment was in 1960 when the Irish party chieftains of the great Eastern and Midwestern cities . . . came together to nominate for President the grandson of Honey Fitz [Kennedy's maternal grandfather who had been mayor of Boston]" (Beyond the Melting Pot, M.I.T. Press, 1963, p. 287). John Kennedy's victory over
18/August 1978/Illinois Issues
Richard M. Nixon was an urban triumph in Illinois. Kennedy's Downstate vote percentage was less than FDR's in four races, and below Harry S. Truman's 1948 total as well. In 1960 Mayor Daley had the numbers in Chicago to carry Illinois for the only successful ethnic presidential candidate in American history. The 1960's also saw the 1964 Johnson landslide sweep all parts of the state of Illinois. The three-way presidential struggle in 1968 produced a narrow Nixon victory and reaffirmed Republican strength Downstate. Humphrey carried seven of the eight (losing Clinton) pro JFK Downstate counties (all the Kennedy counties were south of Springfield except for Rock Island) and picked up victories in Pulaski, Franklin, Macon and Fulton counties. Nixon's downstate vote margins were nearly the same in his 1960 defeat and his 1968 victory. The difference lies in Humphrey's smaller Chicago plurality than JFK. and Nixon's enormous 1968 vote gains in the suburbs and Collar counties.
The 1960's also show that voters in the Other 96 counties liked Democrat Otto Kerner in the gubernatorial election. In 1960 and 1964 Kerner received more votes in the Other 96 than his Republican foes even though his opponents Stratton (1960) and Charles H. Percy (1964) carried more Downstate counties. Richard B. Ogilvie's 1968 impressive Republican victory against Democrat Samuel H. Shapiro flipped the Downstate gubernatorial vote back to the Republican side and set up Ogilvie's 1972 battle against Democrat Dan Walker. The 1970's have not been very good to Democratic presidential and gubernatorial candidates in Illinois. Since 1872 in presidential races, only James A. Cox (1920) and Adiai E. Stevenson II (1956) have lost by percentages greater than McGovern in 1972. In the same election, Walker shocked almost everyone by defeating incumbent GOP Gov. Ogilvie and thus giving state Democrats their only presidential or gubernatorial victory of the decade. The year 1976 saw Democrat Jimmy Carter barely losing to incumbent Ford in a close presidential contest. Carter made some inroads Downstate in winning 34 counties — 32 of which had supported Walker in 1972. Carter's two other counties not won by Walker were Massac and Rock Island. Democratic gubernatorial candidate Hewlett in 1976 took the worst gubernatorial drubbing in the history of the state. His losing margin of over 30 percentage points topped the 28-point loss of 1904 Democrat gubernatorial candidate Lawrence B. Stringer.
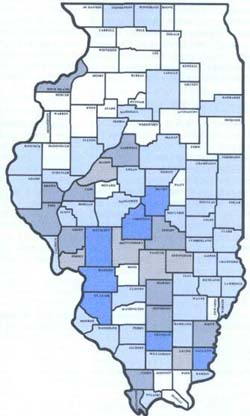
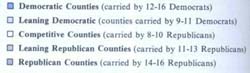
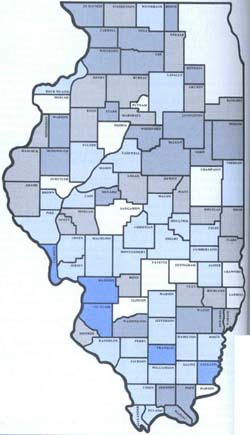
Downstate politics today There were 16 statewide contests in Illinois from 1970 through 1976. Most of these campaigns resulted in one-sided victories. The contests won by less than a 10 per cent margin were Democrat Alan J. Dixon in 1970 for treasurer, Democrat Walker for governor in 1972, Democrat Hewlett for secretary of state in 1972, Republican George W. Lindberg for comptroller in 1972, Republican Ford for president in 1976 and Democrat Michael J. Bakalis for comptroller in 1976. Among the onesided victories were, of course, the biggest Republican and Democratic victories ever. Republican James R. Thompson was elected governor in 1976 by 1,390,137 votes, carrying 100 counties. Democrat Dixon — in 1976 — won the race for secretary of state by a plurality 1,344,283, sweeping 89 of 102 counties. Other big Republican winners were Nixon for president (101 counties), Percy for U.S. senator (102 counties), and William J. Scott for attorney general (98 counties) in 1972, and Scott again in 1976 (98 counties) for attorney general. Other big Democratic winners (over 55%) were Adiai E. Stevenson III in 1970 for U.S. senator (45 counties) and his reelection in 1974 (78 counties), Dixon in 1974 for reelection as treasurer (89 counties), and Bakalis in 1970 for superintendent of public instruction (33 counties). In sum, there have been five big wins for each party and six close contests (four won by Democrats) during the 1970's. Obviously, voter preference for individual candidates and a large amount of ticket-splitting is reflected in these results. Nonetheless, a large number of counties remained generally loyal to the candidates of one party or the other. Figure 4 displays the number of party victories in each county for all statewide races since 1970. With few exceptions, the pattern revealed is virtually identical
August 1978/Illinois Issues/19
with figure 3 showing results from presidential and gubernatorial contests since 1932. Based on the classification scheme in figure 4, we can identify five counties as solidly Democratic, 22 as leaning Democratic, 11 as competitive, 25 as leaning Republican and 22 as solidly Republican. Looking at the 1976 votes for president, governor and secretary of state gives additional insight into the current voting habits of downstaters (see table 7). Thus, even in the five most Democratic counties in Illinois, Thompson won 56 per cent of the vote and a 26,000-vote margin over Hewlett. As one moves from these five counties to the solidly Republican counties, Thompson's percentage increases to 77 per cent. On the other hand, Dixon's victory over Republican William C. Harris for secretary of state is nearly the opposite. Dixon actually won the 22 most Republican counties in Downstate Illinois by 5,000 votes and a margin of 51 to 49 per cent. His vote percentage increased to 75% in the most Democratic counties. Both the Thompson and Dixon votes are extremes — the best examples of what each party can achieve in Down-state. Thompson, in total , won 69 per cent of the 96-county vote for a plurality of 670,000 votes. Dixon won 61 percent of the Downstate vote, a margin of 385,000 votes. As a sidelight, notice that Dixon did better in the six-county Chicago metropolitan area than Thompson. Thompson's statewide total of 1,390,000 was only a little better than Dixon's 1,344,000. Both won 65 percent of the vote in their races. The Carter-Ford presidential race is more interesting because it was close. Carter captured the best Democratic and leaning Democratic counties. Ford won the usually Republican and competitive counties. If one combines the votes of the 49 counties classified as Democratic or competitive, Carter outpolls Ford by 14,000 votes. These 49 counties cast 66.5 percent of the Downstate vote. Ford's margin of victory Downstate came from the other 47 counties which cast only 33.5 per cent of the total Downstate vote, but which were very loyal, giving Ford 59 per cent of their votes for a plurality of 107,000 in those counties. As shown in figure 4, these crucial 47 are comprised largely of rural counties in Sidestate, North Central and Southeastern Illinois. 20/August 1978/Illinois Issues GOP future Downstate Republicans in Illinois are oriented to personalities and not the party. Unfortunately for GOP Downstate organizers, most of the personalities are from the Chicago area. Many Downstate publicans resent the suburban Cook-Collar county leadership of their party as many Downstate Democrats resent Chicago's dominance in the Illinois Democratic party. For example, the last GOP downstater to run for governor was William G. Stratton (1960). Ralph Tyler Smith (appointed to the U.S. Senate following Everett M. Dirksen's death) was the last GOP downstater to run for U.S. Senate (1970). In 1980 the U.S. Senate seat of Adiai E. Stevenson III will be up for election, and already former Gov. Ogilvie, a Cook County resident, is the early favorite to be the GOP senatorial nominee. Downstate GOP county chairmen want jobs and recognition from statewide Republican officeholders. It is ironic that Jim Thompson, the best gubernatorial vote-getter in the state's history, has received his harshest criticism to date from disgruntled county chairmen in his own party. He and most other GOP leaders have recognized this problem; in the 1978 primary they supported either openly or tacitly Downstate Republicans for the state comptroller and state treasurer slots on the Republican ticket. Population figures dictate that Republicans in suburban Cook and the Collar counties will control their party. But GOP suburbanites cannot win statewide elections alone. The Republican key is to maintain a Downstate-suburban alliance. As we said in our previous article, "Suburban and Downstate voters can outvote Chicago, and if political patterns remain unaltered that means Republican victories and Democratic defeats" (February 1978, p. 11). Democrat future Downstate In 1972 Nixon came within 754 votes of defeating McGovern in every Illinois county. The Democratic presidential candidate carried only Jackson County the home of Southern Illinois University and was trounced almost everywhere else in the state. Yet, at the same time, Dan Walker beat the Republican incumbent Ogilvie and became the first Democratic gubernatorial candidate since Horner to carry a majority of the Other 96 counties.
On July 7, 1971, Walker began his campaign with a 1,1 97-mile walk through Illinois. Starting at Brookport in Massac County he walked until he reached Chicago on October 31, 1971. He zigzagged through the state, touched parts of 37 of the Other 96 counties and in his own words, "attempted to walk within fifty miles of every Illinois voter." The publicity from this long march, Ogilvie's support of the state income tax and the voters' tendency to split their tickets gave Walker strong leverage Downstate. Walker also made inroads in traditional Republican Sidestate. He carried DeKalb, Henderson, Henry, Mercer and Putnam counties. Even Horner could not win these counties in his 1932 and 1936 landslide victories. Walker also became the first Democratic gubernatorial candidate since Horner to win Clark, Clay and Richland counties in the Southeastern part of the state. Walker believes his totals reflect, "a special relationship" he developed with the people he met on the walk. Whatever the reasons, he won counties that few Democrats had ever carried and he did it during a Republican presidential landslide. The other Democratic winners in close 1970's races also showed Down-state appeal — Alan Dixon carried 51 Downstate counties in his 1970 state treasurer race, Mike Hewlett won 53 in his 1972 secretary of state battle, and Mike Bakalis captured 36 Downstate counties in his 1976 comptroller contest. Thus, the 1972 Walker campaign serves as a model for future Democrats interested in winning statewide elections. By taking the campaign to the people beyond Cook and the Collar counties Walker showed an awareness that for a Democrat to win Illinois: "Downstate holds the key to victory." August 1978/Illinois Issues/21
|
|||||||||||||||||||||||||||||||||||||||||||||||||||||||||||||||||||||||||||||||||||||||||||||||||||||||||||||||||||||||||||||||||||||||||||||||||||||||||||||||||||||||||||||||||||||||||||||||||||||||||||||||||||||||||||||||||||||||||||||||||||||||||||||||||||||||||||||