 |
Home | Search | Browse | About IPO | Staff | Links |
|
Home | Search | Browse | About IPO | Staff | Links |
By RICHARD KOLHAUSER - Deputy director of the Bureau of the Budget, he has worked under three governors in the area of state finances since 1970.
ILLINOIS VOTERS have sent a clear and emphatic message to Illinois legislators: Government spending must be controlled. Even though Illinois has had balanced budgets the last two years, voters want curbs on government spending. But simple as the message is, it isn't as easy to determine ways and means to respond to it.
Revenue-spending limits can take many forms, ranging from actual cut-backs in the spending base to annual increases in spending subject to specific and more or less severe restraints. Given the intensity of taxpayer feelings, however, there is a genuine danger that limits on spending (or perhaps a limit on revenues) will be imposed before the delicate and defining linkages between spending, taxes and state economic growth are fully considered.
Most commonly, spending limits are related to general economic growth in a state, so that state spending may actually increase each year and new taxes may remain a possibility but subject to tougher requirements for enactment. This is true of the proposed constitutional amendment. House Joint Resolution 22, which would limit spending. Sponsored by Rep. Donald L. Totten(R., Hoffman Estates), H.J.R.C.A. 22 passed the Illinois House in 1977. It is also true of the newly proposed constitutional amendment drafted by the Illinois Tax Limitation Committee, which is chaired by Totten (for details, see "Illinois Tax Revolt," December).
|
* This is fiscal year 1970 and all years
|
Assuming that the revenue-spending limits a re connected to economic growth, it is important to examine the past history of revenue-spending and economic growth of state government in Illinois. The results of such an analysis suggest that state spending in Illinois has been consistent with economic growth in the state for the last five years. State spending in the future will likely be etermined as it has in the past, by spending trends in a few basic areas. While state spending (all appropriated funds) increased from $3.5 billion in 1970* to $8.6 billion in 1978, the average rate of increase per year over that span was 12 per cent. In that same period (1970-78), the average annual growth in the economy, measured by changes in personal income nationally, was 10 per cent, while the average annual growth in inflation was 7 per cent. State spending over those eight years increased two and one-half times and the annual rate of increase was somewhat higher than the rate growth in the economy. |
4/ January 1979/ Illinois Issues
More significant, however, is record over the past five years. State spending has increased at a much lower rate, culminating in 1978, when total spending for all appropriate funds increased just two-tenths of 1 per cent over the $8.56 billion that spent in 1977 (see table l).This dramatic trend toward slower growth in spending resulted from strong administrative controls over spending (a balanced budget in 1978, a hiring freeze) as as sustained economic growth.
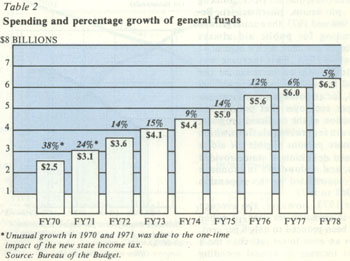
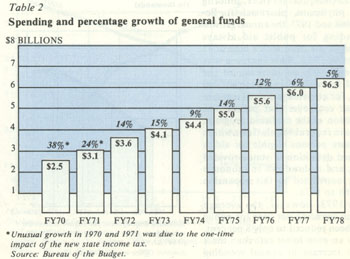
While the trends involving all appropriated funds are important,those which relate to the state's general funds are especially significant; and they reveal a similar pattern in state spending. The general funds support education, public aid, mental health and dozens of other state programs, all of which account for nearly 70 per cent of total state expenditures each year. Revenue for the general funds comes mainly from the state income tax and sales tax. Like total state spending, eneral funds spending increased by two and one-half times from 1970 to 1978, from $2.5 billion to $6.3 billion. The average annual rate of increase was 12 per cent, as compared to the 10 per cent average annual growth in the economy and the 7 per cent average annual increase in inflation.
Once again, the record from 1973 to 1978 is even more revealing, suggesting that Illinois has, in fact, limited its spending to the overall economic growth over that period. The balance between spending and economic growth was achieved only after a state fiscal crisis was resolved. Spending increases had been outstripping economic growth, threatening a tax increase by 1977. That threat however forced a sharp reduction in spending growth (see table 2). The 5 per cent spending increase in 1978 was the smallest annual increase since 1963, and prevented the imposition of new taxes in 1978.
A balanced relationship between the growth in state spending and growth in the economy is crucial to the state's financial well-being. If, over time, state spending increases faster than the economy increases, revenues will fall short of spending and state taxes have to increase.
This can be demonstrated by comparing the growth in state spending to economic growth for the last 25 years. The average annual growth in general funds spending over the last quarter century (1953-78) has been almost 12 per cent, while the economy grew only in average of about 8 per cent. In contrast, state revenues grew at about the tame rate as the economy. The backbone of the revenue structure in years past was the state sales tax (almost 70 per cent of state revenues in 1963). The sales tax grew at very nearly the same rate as the economy over the last quarter century increasing at an annual rate of 7 per cent over that period, while the average annual growth in the economy was 8 per cent, based on the average annual change in U.S. personal income.
Since the state income tax was added as a revenue source in 1970, total state revenues have grown at the same rate as the economy, both of them increasing at an average annual rate of 10 per cent since 1973.
If the "natural" growth in state revenues from 1953 to 1978 was about the same (but somewhat slower) than economic growth (8 per cent), but state spending increased an average of 12 per cent, it is apparent state taxes had to be increased. In fact, since 1953 five major tax increases were required to finance the growth in state spending, including sales tax increases in 1955, 1959, 1961 and 1967, and the imposition of the state income tax in 1969. But tax increases have not been required in the last five years since spending, revenues, and the economy have all grown at approximately the same rate. It is difficult to predict whether this balance will continue, but the examination of historical spending trends for major programs offers some basis for speculation.
While the aggregate growth in state spending is comprised of trends for dozens of state programs, it is significant that three program areas, broadly defined, represent 85 per cent of all general funds spending. Education, including elementary and secondary schools, universities, special education, community colleges, retirement systems and scholarships, accounts for 39 per cent of that total. Public aid grants received 30 per cent of that total, and state operations, 16 per cent. The remaining 15 per cent finances grants for other programs as well as tax relief for the elderly (Circuit Breaker), state revenue sharing with local governments, public transportation subsidies and debt service.
|
|
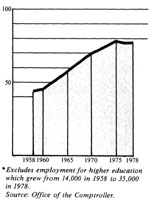
Spending for operating state government includes wages and salaries,travel, equipment, computer costs plus other costs. Wages and salaries for state employees, however, is the single largest item under operating costs, accounting for about 75 per cent of the total. But, growth in operating costs has been less than the growth in total spending. Since 1973 the average growth in operating costs has been 7 per cent compared to the 9 per cent average growth for all general funds spending. The comparatively slow rate of growth for operating costs is, in part, attributable to a leveling off in state employment, which grew from about 42,000 in 1958 to 79,000 in 1975, and then actually declined and stabilized at about 78,000 from 1976 to 1978. But the two major programs financed by the general funds education and public aid have historically determined the trends for total state spending. The annual growth rates for education |
5/ January 1979/ Illinois Issues
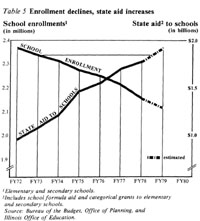
spending were particularly high during 1967 through 1971, at times reaching 20 to 30 per cent annually. In the last five years, however, comparitively moderate spending growth, triggered by a decline in school enrollments, has occurred. For example, the average annual growth in spending for education since 1973 has been 9 per cent.
Within the composite 9 per cent education growth rate, spending increases for higher education averaged 7.7 per cent and 9.4 per cent for elementary education. The continuous decline in school enrollments which began in 1971 has helped to relieve spending pressures. But the impact of this decline for elementary and secondary education has not been as great as might have been expected since state spending has accelerated for school programs unrelated to enrollments, such as textbooks, bilingual education, teacher retirement, transportation and special education. While the average annual growth rate for the 1973-78 period for general state aid to schools under the school aid formula has been 8 per cent, the average annual growth rate for other aid has been comparatively high at 13 per cent.
|
|
The spending trends for public aid programs have been even more dramatic than those for education. Public aid consists primarily of income assistance (aid to families with dependent children and general assistance) and medicaid (hospital services, nursing homes, physicians, pharmacists). Between 1968 and 1973, the annual growth in spending for public aid always exceeded 20 per cent, with a high of 41 per cent in 1971. This increase was consistent with an increase in the caseload, from60,000in 1968 to 197,000 in 1973, for an average annual increase of 27 per cent over that period. The introduction of the medicaid program, changes in federal regulations which made more persons eligible for aid, a broadened definition of state-provided services, and a slowdown in economic growth contributed to this expansion from 1968 to 1973. Since 1973, however, the average growth in spending per year for public aid has been reduced to only 8 per cent, which is an even lower rate than the 9 per cent increase in annual spending from the general funds over that same period. Lower spending for income assistance primarily the aid to families with dependent children program accounts for that stabilization, even in the face of double-digit increases in medicaid spending during that time span. |
|
Table 4 (in thousands)
|
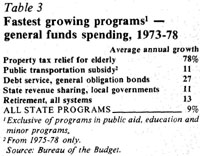
By now it should be clear that spending growth and economic growth were in balance during 1973-1978 because the spending trends for both education and public aid changed sharply from those of the late 1960s and early 1970s. If both school enrollments and public aid caseload had not dropped in recent years, state spending would have been pushed much higher, requiring new taxes. In contrast, however, to the recent stabilization of the three most significant areas of state spending, some individual programs in the budget are growing at a rate well above the rate of economic growth (see table 3). As might be expected, among the fastest growing programs are many comparatively new ones property tax relief for the elderly, subsidy to public transportation, state revenue sharing with local governments and debt service (repayment of money borrowed through general obligation bonds for capital construction). All of these programs are new to the state since 1970. While the programs in table 3 cornprised only about 13 per cent of the budget in 1978, they accounted for almost 34 per cent of the increase in general funds spending. |
It is possible to derive a spending, outlook for individual programs by examining projections of the factor which drive spending, the same factor used to understand historical spending trends. The spending outlook for the general funds clearly depends upon the outlook for the three largest programs the fastest growing programs and any major new "demand" for state provided services.
Any change in the underlying factor driving spending in the largest and/or fastest growing programs could create an especially fierce competition among program areas for new funds, especially if total spending were limited in some way. Similarly, any major new program would begin to draw funding away from existing programs if total spending were constrained by some method.
In this analysis, inflation is presumed to affect spending in all program areas Since state revenues (general funds grow along with inflation, whatever the rate, inflation driven increases in spend ing are largely provided for. The major exception to this assumption is inflation in the delivery of health care, a fact reviewed later.
State spending for the management and operation of state government (16 per cent of general funds budget) it future years will depend, of course, upon the number of state employees and the rate at which salaries are increased The impact of collective bargaining for state employees is difficult to predict but it will be a very significant factor.
The number of state employees has not grown since 1975 (see table 4), and a
6/ January 1979/ Illinois Issues
It has proven extremely difficult to eliminate or even reduce existing programs. For this reason it seems unlikely state employment will show a substantial decrease from current levels.
But collective bargaining is new to Illinois, and its impact on the wages and salaries of state employees will largely determine the growth in spending for operating and managing state government. If total state spending is held to some predetermined total each year, as under a spending limit, the larger the wage increase for state employees, the fewer dollars available for other state spending. This fact alone creates substantial pressure for "reasonable" wage settlements in the future.
State spending for education, which is almost 40 per cent of the general funds budget, will be influenced, at all levels, by the projected trend for school enrollments. The decline in school enrollments, which began in 1971, is expected to continue for another decade (see table 5).
Although the decline in the number of students and teachers will continue, this alone does not mean that education's "claim" on the budget will lessen. New arguments for increased spending will develop; new programs will be developed. As the growth in funding for general state aid slows, funding for other education programs not based on enrollment is increased. Overall, education interests will struggle to keep education spending a relatively constant proportion of the state budget.
The long-term spending trend for public aid remains a wildcard. Spending for public aid is the second largest item in the budget (30 per cent), and funding is "open-ended," since the state must Pay all eligible applicants. Since public aid funding levels are influenced by economic growth, funding levels can vary dramatically from year to year moving with the economic cycle.
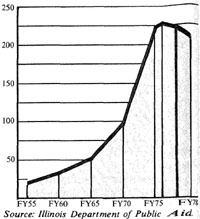
The caseload trend for almost the last three years has been one of near steady decline with a caseload drop of 4 per cent. Table 6 puts this drop into Perspective by showing the overall growth in cases since 1955.
It is still too soon to tell whether the declining caseload is due primarily to economic growth (expanding employment opportunities) and/or a fundamental trend, such as a change in net Illinois migration, fewer women of child bearing age and change in divorce rates. Continuation of the downward trend is essential if the growth in total state spending is to be kept in line with economic growth.
However, the experience during the 1975 recession demonstrates how rapidly the caseload can change with the economy. As the economy lost steam, caseload grew by 11 per cent from November 1974 to October 1975.
|
The spending outlook for the health component of public aid medicaid -- is not especially encouraging. Medicaid spending (17 per cent of the budget) continues to advance rapidly, one reason being that health care cost are rising at an annual average rate of 10 per cent, while the average annual inflation generally is increasing at a rate of 8 per cent. Management control over the costs of health care provided to public aid recipients and low-income families has become an essential task. Review and setting of the rates for health services charged to the state by health providers has become one of the most important areas of management control in the entire budget. The challenge is to design rates which fairly reflect costs to health care providers, but which are also part of an overall plan that discourages abuse and unnecessary cost increases. Controlling rates is also essential to allow spending growth in other areas of the budget, especially if the budget were to be tied to economic growth in the future. |
Each year the state income and sales taxes grow along with the economy and so, according to the formulas, does spending for state revenue sharing and public transportation. The growth in spending is "automatic" in that funding is not based upon an annual review of program need but rather upon revenue growth. This means that each year funding for these programs is first subtracted from revenue growth, and other programs then compete for a share of the remaining new revenues. Modification of the funding mechanism for these two programs would be hard to
january 1979/ Illinois Issues/ 7
achieve.
Cities and counties in Illinois receive one-twelfth of the state's income tax receipts. The share for each unit of local government is determined by the proportion of its population to total state population. The state currently provides about $ 180 million to local governments on a "no strings attached" basis.
The state subsidy for public transportation (general funds only) consists of about $122 million for the Regional Transportation Authority (RTA) encompassing Cook, DuPage, Kane, Lake, Mc Henry and Will counties and $12 million for downstate transportation systems. The RTA receives 3/ 32 of the sales tax collected in its six-county region while the downstate systems receive 1/32 of the sales tax collected.
The state borrows money through the sale of general obligation bonds to finance the construction needs of the state. First permitted in 1970 by the new state Constitution, general obligation bonds are sold so that it is not necessary to use current revenues to finance the construction. The theory is that construction projects, such as highways, school buildings and sewer systems, have many years of useful service and that the taxpayers who receive the benefits from the projects should be the ones who help pay for the projects. The repayment of the money loaned to the state is typically spread out overa20-to- 25-year period. Repayment consists of both a portion of the amount borrowed (principal) and the cost of borrowing (interest). Together interest and principal are called debt service.
The more the state builds, the more the state must borrow, and the greater the costs of debt service. State spending for debt service has been a high growth area of the budget, increasing three-fold in the last five years. In 1973 debt service costs from general funds were $39 million rising to $129 million last year. This rapid growth in spending has, of course, meant slower growth for other areas of the budget.
State appropriations for construction reached a peak of $1.9 billion in 1976. Since that time appropriations for capital projects have been slowly reduced to $1.4 billion in 1978. Bond sales have also dropped from a high of $535 million in 1977 to about $400 million in 1979. Consequently the growth in spending for debt service has also slowed.
In order to sell bonds at the lowest cost to taxpayers, the state must maintain a good credit rating. Currently Illinois has the highest rating possible (AAA). To maintain this rating the state must manage its finances carefully and control the amount of bonds sold each year. In turn, state spending for debt service will also be controlled. The outlook then is for somewhat slower growth in spending for debt service.
Spending for the state's pension systems (state employees, university personnel, teachers, legislators, judges) will grow in the future. Pension costs are tied to the method of funding, the number of retirees, the average income at retirement and cost-of-living adjustments. All of these underlying factors will put considerable upward pressure on spending for retirement. Even tight control over state employment will not appreciably change the trend to retirement spending for another 20-to-30 years.
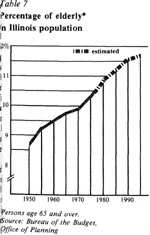
The single most important area where there is likely to be a "demand" for new services is the elderly. The elderly population is growing both in absolute numbers and as a percentage of the population (see table 7). This population increase may be translated into arguments for additional spending for programs for the elderly.
The pressures for new spending for the elderly are already in evidence. A new Department of Aging was created in 1973. Funding for the agency has risen from $6 million in 1974 to $39 million in 1979. This year a new program exists to provide home health care as an alternative to nursing home care. Property tax relief for the elderly, first enacted in 1972, has already been expanded six times. Other new programs for the elderly are likely to be demanded in coming years.
|
Table 6
Average monthly caseload, (in thousands)
|
The statistics for education and the elderly can be used to illustrate an essential problem if state spending is to be effectively limited in future years. Will spending growth slow in areas where "need" is declining so that faster spending growth is possible in areas where "need" is growing? Over the last quarter century state spending from the general funds has grown faster than the economy, and five major tax increases were required. the last five years, however, a rough balance has been established between I growth in state spending and economic growth, and this trend suggests so hopeful possibilities for the future fiscal situation in Illinois. Among existing state programs, the spending outlook for only a few programs will likely determine how fast state spending will increase in the future. The growth in state employment! slowed, suggesting stable growth, in future for spending for operating state government. School enrollments have decreased for the last 10 years and are expected to decrease for another years. This trend has implications spending for elementary schools, high schools and state universities. Public caseloads will likely not increase at very high rates of the 1960s and early 1970s. Continued inflation in costs health care will, however, push up medicaid spending, offsetting slower increase in income assistance. ln any case, public aid spending should not increase as fast in the years ahead unless the economy does not perform. |
The number and percentage of elderly in the Illinois population are increasing rapidly suggesting that "demands" state provided services will also increase. Formula driven increases spending for local governments and public transportation may be hard to
8/January 19791 Illinois Issues
slow. The rapid growth in spending for debt service has already been slowed, and fear of the state losing its AAA rating helps to provide a check on capital spending. Spending for retirement will continue to increase rapidly.
Two other "new" programs have the potential for spending growth of the type that can unbalance future budgets special education and in-home health care. Future funding levels for special education (Illinois has adopted new federal guidelines) and for in-home health care, unfortunately, are not yet clear. The programs are still not understood well enough to accurately judge low many new dollars will be needed.
With these trends in mind the outlook or state spending could be constructed by adding together the expected costs of he individual programs. In the past this procedure frequently resulted in state pending which exceeded revenues. More revenues were then found.
|
But the dominant mood today, quite cleary, is for a different approach to determine spending. One expression of this mood is the spending limits which have been adopted in several states. A spending limit begins with total spending determined at the outset, and spending for individual programs is then determined on a priority basis. Theoretically, at least, this is an important difference from letting program "needs" create total spending. In practice, however, if the balance between economic growth and spending growth is not a "natural" occurrence, taxes will increase whether or not a spending limit is adopted, because these limits usually contain emergency provisions to meet extraordinary circumstances. |
Many of these conditions are linked to national and even international trends over which Illinois lawmakers have little or no control. But rigorous analysis, careful planning and tough decisions can help to realize these necessary conditions. The people of Illinois may continue to enjoy quality educational systems, humane public aid programs and other important state services without the burden of additional taxes.
January 19791 Illinois Issues/9
|
Sam S. Manivong, Illinois Periodicals Online Coordinator Illinois Periodicals Online (IPO) is a digital imaging project at the Northern Illinois University Libraries funded by the Illinois State Library |