|
Home | Search | Browse | About IPO | Staff | Links |
|
Home | Search | Browse | About IPO | Staff | Links |
|
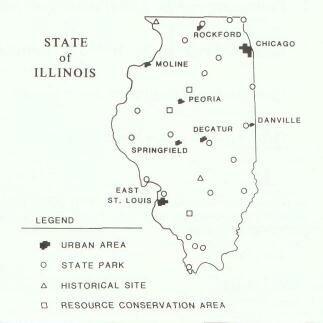
Survey Of Visitor Expenditures Near Recreation Areas Reveals Impact on Local Economies* Recreation related expenditures are an important source of revenue for local economies. This article describes a survey of visitor expenditures made in local communities near state parks, historic sites, and hunting and fishing areas. Categories of expenditures covered included food, transportation, lodging, miscellaneous items such as sundries, and government fees. By Stanley R. Lieber The local economic impact of outdoor recreation areas and historic sites is of concern to public land managers and private developers. Does a recreation area or the designation of a historic site help or hinder a nearby town? This is an important question for local governments because local economic impacts describe gains and losses in sales, personal income, employment and taxes to local communities resulting from the presence of an enterprise. State parks, historic sites, and hunting and fishing areas affect local economies just like other businesses. However, money brought into communities and money spent by the State of Illinois in operating and maintaining their facilities is often unrecognized by local communities. How big are these impacts? The purpose of this paper is to present information regarding the contribution made to local economies by the presence of outdoor recreation areas and historic sites in Illinois. Twenty-five sites in Illinois were visited between May, 1981 and February, 1982 so that interviews gathered on-site would be representative of visitor expenditures throughout the year. The accompanying map shows the urban areas of Illinois and the sites that were visited. The 25 sites were chosen to be representative of the different conservation and recreation areas managed by the state and to include the bulk of the state's outdoor recreation visitation. Forty percent of the Department of Conservation's visitation (about 30.8 million activity days) took place at these 25 sites. Expenditures are portrayed by categories (food, transportation, lodging, sundries, government fees) in Table One and are calculated in per-person-per-day amounts. Expenditures ranged from large amounts such as $37.97 per person per day at Horseshoe Lake (Alexander County) to $1.23 at Argyle Lake. These variations are to be expected. For example, expenditures at or near Horseshoe Lake were obtained during hunting season whereas data gathered at Argyle Lake were obtained in February, when relatively modest use occurred in the park. Differences between visitor expenditures at parks, historic sites and hunting and fishing areas were expected. Historic sites within major metropolitan or tourist areas had higher expenditures while historic sites outside major areas had expenditures comparable to most parks and recreation areas. Visitor expenditures from the twenty-five sites were averaged and adjusted for the occurrence of interviews during hunting season or special events. As a result, it is estimated that slightly over $5.80 per-person-per-day (for all categories of expenditures taken together) is spent in local areas by visitors. If we multiply $5.80 by the number of activity days of visitation recorded at state properties and add to this amount the monies spent for maintenance and operation of these facilities (including wages to local personnel and local sales purchases) we arrive at a figure of $185.6 million for the 1981 fiscal year. This compares
*This paper is a shortened summary of a chapter of the author's book. Recreation Planning and Management, published by Venture Publishing Co.. 1640 Oxford Circle, State College, Pennsylvania 16801. Illinois Parks and Recreation 18 September/October 1983 to about $628.6 million that the Illinois Office of Tourism believes "pleasure" travelers spent in the Chicago area during 1981. These figures exclude capital improvements which are made periodically at state sites — such as resurfacing park roads. All impacts described to this point have been "direct" in nature. That is to say, that these economic impacts do not cover indirect local expenditures which are the effects of the responding of monies in the local economy which generate even greater total impacts. The Bureau of the Budget believes that most indirect impacts approximate between 50 and 100 percent of the direct impacts. As a result, it would be reasonable to assume that direct and indirect income generated by state parks, historic sites and hunting and fishing areas generate at least $300 million to the local economies of Illinois. In closing, we are not claiming that State recreation and historic areas do not impose costs on local economies. However, with the development of new businesses and the expansion of existing businesses catering to visitors, and increased level of economic activity in the local area usually results. In a time of lagging economies, these benefits provide an important complement to the recreational, cultural, and environmental value to the people of Illinois.
ABOUT THE AUTHOR:
Table 1
Illinois Parks and Recreation 19 September/October 1983 |
||||||||||||||||||||||||||||||||||||||||||||||||||||||||||||||||||||||||||||||||||||||||||||||||||||||||||||||||||||||||||||||||||||||||||||||||||||||||||||||||||
|
|