 |
Home | Search | Browse | About IPO | Staff | Links |
|
Home | Search | Browse | About IPO | Staff | Links |
|
State Stix If you're so rich, why are you living in the country?
During the 1980s the economic base of the nation's rural areas was eroded by declines in forming, mining and the timber industry. In a sample of 10 mid western and northwestern states, the number of non-metropolitan poor, 1.73 million, is far less than the number of metropolitan poor, 2.89 million. Without Illinois, however, the numbers of city and rural poor are virtually equal. Source: Robert D. Plotnick, Poverty in Non-metropolitan and Metropolitan Areas of Illinois, Wisconsin and the Greater Northwest. Research Report for Woods Charitable Fund. (The poverty estimates are based on the combined March 1986 and 1987 Current Population Survey data tapes of income data for 1985 and 1986. "Non-metro" means "not living in a metropolitan statistical area," and "poverty" means the official poverty lines established by the Census for 1986.) 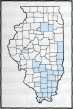
Downstate Illinois counties with
Don't jump to conclusions! A double digit unemployment rate doesn't necessarily mean lots of people and vice versa. It depends on the size of the workforce. 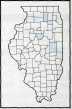
Downstate counties with an average unemployment rate of less than 5 percent in 1988
Source: 1988 annual averages, Department of Employment Security. Why Woodford County? Reasons why Woodford County (mostly agricultural, population 33,000) has a low jobless rate:
Source: Kevin Pearson, director of economic development for Woodford County, Peoria Economic Development Council, Peoria. Metro area statistics sometimes mask central city unemployment The following central cities had jobless rates above 9 percent and at least 2 percent higher than their respective metropolitan statistical areas. The unemployment rates are seasonally unadjusted averages for the year 1988.
How sweet it is! The world's largest candy bar, a 7,200 lb. "Crunch" bar requiring $8,000 worth of ingredients rolled off the line at the Nestle-Beich plant in Bloomington in April. The giant confection (union made) with its $3,000 wrapper was sent to Wal-Mart in Wagoner, Okla., in a $2,000 shipping crate. Source: Livingston & McLean Counties Union News, May 1989, Bloomington. On the road Currently the jumbo bar — a milk chocolate-crispy rice combo, measuring 25 feet by 6 1/2 feet by 7 5/8 inches — is touring the nation. It will be auctioned off on the Fourth of July and the proceeds used to help the homeless. Source: Joe Swenson, Wal-Mart, Wagoner, Okla. $$$$$ The general funds end-of-month balance in April was $480,149 million, the most since April 1985 when it was $591 million. The average daily available balance was $282,652. Source: Office of the Comptroller. Unemployment rate down In April the national seasonally adjusted unemployment rate rose to 5.3 percent, while the Illinois rate dropped to 5.4 percent. There were 5.960 million people in the state's labor force, 23,000 fewer than in March; 5.640 million had jobs, 8,000 fewer; 320,000 were unemployed, 15,000 fewer. Final unemployment rates in the state's metro areas in February:
Bloomington-Normal, 4.5 percent. Champaign-Urbana-Rantoul, 4.2 percent. Chicago, 5.3 percent. Davenport, Rock Island, Moline (Illinois sector), 6.9 percent. Decatur, 7.7 percent. Joliet, 7.0 percent. Kankakee, 8.8 percent. Lake County, 4.4 percent. Peoria, 6.3 percent. Rockford, 6.2 percent. Springfield, 5.3 percent. St. Louis (Illinois sector), 7.7 percent. Source: Department of Employment Security. Margaret S. Knoepfle June 1989 | Illinois Issues | 5
| ||||||||||||||||||||||||||||||||||||||||||||