|
Home | Search | Browse | About IPO | Staff | Links |
|
Home | Search | Browse | About IPO | Staff | Links |
|
Municipal Compensation Package, 1988 By NORMAN WALZER and POH P'NG* The relatively heavy orientation of municipal expenditures toward personal services makes negotiating compensation packages a major, if not the most important task, of a municipal official's duties. Every year, negotiations become more complex as employee organizations are stronger and equipped with information on compensation practices in cities throughout Illinois. The bargaining process has reached the stage where many cities employ consultants or have an internal agency to work with officials involved in the negotiations. While this assistance adds to the costs of managing a city, it can pay off in better negotiating procedures and, ultimately, mean cost-savings for the city. Not every city has the funds to obtain this assistance, however, and in those cases it is important that officials carefully review the costs of the compensation package being developed. Annually, the Illinois Municipal League publishes a Compensation Survey containing detailed wage and benefit information for cities larger than 5,000 in Illinois. This compensation information provides a ready comparison of what cities throughout the state are providing for representative positions and benefits. This article provides a relatively simple method of combining the information contained in this survey into an estimated cost to the city. The approach presented here does not displace the need for professional assistance in city negotiations but can be useful at the city level, especially when limited staff time is available. Determining Cost of Compensation Estimating the cost to a city of providing a compensation package involves determining the costs of both money wages and employee benefits. The latter are especially difficult to determine and, in some instances, are virtually beyond city control once initiated. Agreeing to a semi-private room at a hospital, for instance, means that the cost will increase as determined by hospital policy. It is important that negotiators understand the implications of these benefits. Money Wages Typically, more than half of the compensation package is represented by money wages. Determining the cost of these wages is relatively straightforward by either extending an hourly rate or monthly salary. A comparison of representative employee classifications reveals a wide range of pay increases, when estimated at pay plan maximum (Table 1). This information was constructed from summary tables which makes interpretation more difficult. Because not all cities respond to the survey each year and because not all cities report both minimum and maximum salaries, shifts in number of respondents can affect averages reported. Approximately 210 of the 230 cities responding to the survey are the same each year so distortions in the data should be minimal. The percentage changes in pay plan maximum ranged from 8.01 percent for laborers to 2.09 for city engineers. The latter change may reflect retirements in several cities such that replacements received lower wages. In these comparisons, as crucial as the percentage increase, is the relative importance of the item in the aggregate expenditure package. For instance, police officers and firefighters usually represent large numbers of personnel and a substantial portion of the budget. In other classifications, the number of employees is small and are not large in the budget. Based on survey information, policy officers and firefighters averaged money wage increases in the 3 to 4 percent range.
January 1989 / Illinois Municipal Review / Page 17 Employee Benefits While money wages are most important in employee compensation packages, employee benefits follow closely at 45 percent or more in Illinois cities. Benefits can be subdivided into two types: time-off and security. In the past, these benefits have been an increasing proportion of total compensation.
a. Time-Off. Employees receive time-off benefits including vacations, sick leave and other benefits. These benefits are more difficult to quantify because they are not always taken by employees. Nevertheless, potentially the city has liability for these expenses and they should be included in the compensation costs. For purposes of cost comparisons, the building custodian employee classification is used. The reported salary (average of minimum and maximum) in 1988 is $18,951 and this salary is used in subsequent calculations. An average two-week vacation costs Illinois cities $729 annually, estimated at the salary of a building custodian. Cities may not hire replacement employees at the same pay rate during vacation breaks or may ask other employees to carry additional work. When inexperienced workers are hired, the same level of productivity usually is not present. In any event, the city bears the cost. Employees receive an average of 10 paid holidays at a cost of $729 per year. Holidays are treated in the same way as vacations. Municipal employees receive an average of 12 days for sick leave. Not all employees take full sick leave benefits and, in some instances, workers can carry unused sick leave into future years. Because cities can incur the full cost sick leave is included. Usually employees receive breaks on the grounds that they enhance productivity. These breaks, although only 15 minutes twice per day, can represent substantial lost work time. For instance, 30 minutes per day at the representative salary is a total of $1,184 each year. For comparison, these breaks have not been included in the total cost of the compensation package but should at least be recognized in negotiations. b. Security. Security benefits are provided to protect employees and families during periods of illness and death. Retirement benefits are a major cost to municipalities and employees are included in several retirement systems. For present purposes the Social Security and Illinois Municipal Retirement Fund contributions are based on the salary of a building custodian. In 1988, the city contribution for retirement was $2,630, up from $2,513 in 1987 or a 4.7 percent increase. Hospitalization insurance in 1988 cost Illinois municipalities an average of $2,431 or an increase of 5.3 percent from the previous year. The cost of insurance varies by city because of differences in benefits provided such as private or semi-private room and so forth. There was only a slight increase in life insurance costs for municipal employees from an average of $110.17 in 1987 to $111.43 in 1988. Likewise, workers compensation manual insurance rates were lower in 1988 than in 1987 but the salary increase brought the estimated premium to the same level. Total Compensation Package The cost of the 1988 municipal compensation package in 1988 was $27,543 for a building custodian. Of this total, benefits represented $8,592 and money wages represented $18,951. Thus, benefits as a percentage of salary were 45.34 percent, approximately the same as in 1987. Employee groups differ in relative importance of benefits. In police and fire departments, especially, retirement costs may substantially exceed those of other employees. Page 18 / Illinois Municipal Review / January 1989
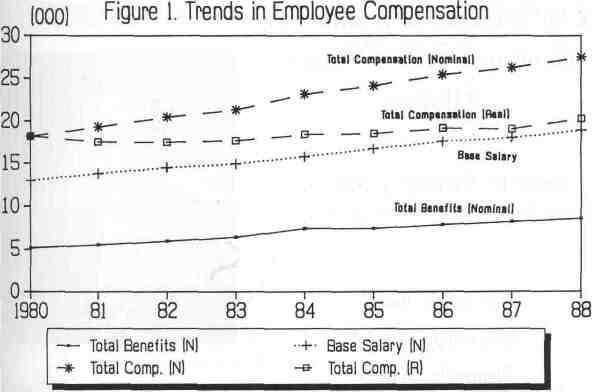
Since 1980, there has been a slight increase in the relative importance of employee benefits as a percentage of total compensation (Figure 1). That increase seems to have halted in 1988. Whether this indicates a long-term trend remains to be seen. Between 1980 and 1988, municipal compensation increased 11.5 percent in constant dollars. In current dollars compensation increased 51.2 percent during the same period. Summary The costs of municipal services are strongly related to compensation paid. Municipal officials need an accurate estimate of the benefit package under consideration to determine the overall effect on the city treasury. The analysis presented in this article does not displace the need for a careful and thorough analysis of the benefits proposed but it provides a comparison of the compensation packages which municipalities in Illinois have provided in recent years. •
* Professor and chair, Department of Economics and Research Associate, Illinois Rural Affairs Institute, Western Illinois University, respectively. The data for this article is obtained from the Municipal Compensation Survey published by the Illinois Municipal League. January 1989 / Illinois Municipal Review / Page 19 |
|||||||||||||||||||||||||||||||||||||||||||||||||||||||||||||||||||||||||||||||||||||||||||||||||||||||||||||||||||||||||||||||||||||||||||||||||||||||||||||||||||||||||||||||||||||||||||||||||||||||
|
|