|
Home | Search | Browse | About IPO | Staff | Links |
|
Home | Search | Browse | About IPO | Staff | Links |
|
By KENT D. REDFIELD
Candidates, campaigns and cash
How Madigan beat the map in the 92 Illinois House elections In early August of 1992, supporters of Vickie Moseley held a car wash in the parking lot of a small north end Springfield furniture store. Business was very slow. The home-made signs urging people to stop drew hundreds of blank stares and about two dozen customers. As the Democratic candidate for the House seat in the 99th legislative district, Moseley's chances of beating the well-known Republican candidate, county Sheriff Bill DeMarco, seemed nonexistent. The 99th had been carefully drawn to elect a Republican and much of the district was in Sangamon County with its powerful Republican organization. Three months later, Moseley had won an easy (59 percent to 41 percent) victory and two months after that Michael J. Madigan, a Democrat from Chicago, was elected to his fifth term as speaker of the Illinois House. When Republicans won control of the redistricting process in the fall of 1991, conventional wisdom suggested that the Senate would surely go Republican, while the Democrats' control of the House might be in jeopardy. Moseley's victory and the role that Madigan played in it illustrate why Democrats were able to maintain control of the House in spite of a map carefully drawn to favor the election of Republican candidates. The House Democrats' winning strategy relied on good candidates, smart campaigns and a lot of help from the speaker, and demonstrated why it's not always wise to trust conventional wisdom.
Of the 97 remaining races which were not targeted, the Democrats won 55 and the Republicans won 42. While the Republicans had an advantage on paper in the number of these districts that strongly favored one party over the other, they failed to capitalize on their advantage because they did not seriously challenge a number of incumbent Democratic members running in Republican dis-
June 1993/Illinois Issues/17 tricts. Democrat incumbents won three districts by fewer than 2,000 votes where Republican challengers spent little money and received little or no support from the House Republican leadership.
Even so, district maps are important. Control over the redistricting process, which takes place every 10 years in Illinois, allows the party in charge to draw a map for maximum political advantage as long as it meets state and federal constitutional requirements. The map drawn by the Democrats in 1981 is credited with salvaging Democratic control of the Senate while facilitating Democratic dominance in the House. The new map worked well for Republicans in the 1992 Senate races. Control of the Senate shifted from a 3 l-to-28 Democratic majority to a 32-to-27 Republican margin. A similar shift in the House would have replaced a 71-to-47 Democratic majority with a 63-to-55 Republican edge. Instead, Republicans gained only four seats and Democrats retained control of the House. The importance of a favorable map can be seen in the race between two longtime incumbent legislators from the Champaign-Urbana area. The old legislative map created one district comprised primarily of the cities of Champaign and Urbana and a second district made up of the more rural areas in the surrounding counties. The rural district typically elected a Republican by a wide margin, the more urban district elected a Democrat and the corresponding Senate district elected a Republican. The Republican map adopted in 1991 created two new legislative districts, the 103rd and 104th, which split the cities of Champaign and Urbana and put each in a strongly rural district. This created two districts that leaned Republican and were among those 21 considered battleground races by legislative leaders. The 104th district was drawn to force a contest between the Democratic and Republican representatives who had been representing the area during the 1980s. Given the political demographics of the new 104th, not even a well-financed campaign by an experienced, respected Democratic incumbent, Helen Satterthwaite, could prevent the equally well-funded incumbent Republican, Tim Johnson, from winning 61 percent of the vote. The corresponding 52nd Senate District elected the incumbent Republican senator with 58 percent of the vote. The new map helped Republicans defeat an incumbent Democrat.
Democrats were also able to frustrate the intentions of Republican cartographers because they enjoyed an advantage in the number of incumbents seeking reelection. Fifty-two
18/June 1993/Illinois Issues Democratic incumbents sought reelection to the House, while Republicans had only 27. Because of their large majority from the 1990 election, the Democrats had more incumbents to begin with. In addition, a number of Republican House members ran for Senate seats being vacated by the retirement of Republican senators, who were under no pressure to run again because of the adoption of a Republican map.
The reelection of one Democratic incumbent illustrates how the advantage of incumbency and serendipitous events can overcome the benefits of favorable district boundaries. Republicans drew the 100th House District, which shares Springfield with the 99th House District, to favor a Republican candidate. Much like their handiwork in Champaign County, mapmakers constructed the 100th district to include the homes of two incumbent lawmakers, Democrat Mike Curran and Republican Karen Hasara. The objective was to force Curran to run against Hasara in a district tailored to her, or to move north into the 99th district which was strongly Republican and also contained much more territory new to Curran. But when incumbent Republican state Sen. John "Doc" Davidson of Springfield decided to retire, Hasara ran for the Senate and won a landslide victory with 69 percent of the vote. Meanwhile, the well-known and widely respected Curran faced a challenger running for the first time and was easily reelected in the 100th district. Under the map drawn a decade ago by Democrats, the Springfield area had a Republican state senator and one Democratic and one Republican state representative. With Vickie Moseley's surprise victory in the 99th district, the Springfield area is now represented by a Republican state senator and two Democratic state representatives. Two countervailing trends have dominated legislative elections in Illinois for the past decade. First, individual candidates, not political parties, have become the focus of the electoral process. It is a rare yard sign, direct mail brochure or media ad that mentions the candidate's political party. Candidates get elected as individuals, not party members. At the same time, the legislative leaders and the political action committees they control have become more powerful influences in the election process. Their power has increased because political campaigns are becoming increasingly expensive (see "Legislative campaigns: the meter is running" on page 20), and the leaders command large, sophisticated campaign organizations which raise and effectively spend large amounts of money. In the six months surrounding the 1992 general election, Speaker Madigan and the House Democratic Majority Committee spent more than $2.5 million, mostly on legislative elections. During the same period House Minority Leader Daniels and the House Republican Campaign Committee spent over $1.9 million. Money is important and the House Democrats had an advantage. But using the money wisely is equally important. Going into the 1992 election, the House Democratic campaign operation was well-respected in Illinois political circles for picking or supporting good candidates and backing them with well-funded, well-organized, well-conceived campaigns. The House Democrats' spending on behalf of their candidates is concentrated on polling and targeting voters, preparing and mailing campaign literature and providing paid campaign managers and staff. (See "Financing legisla-
June 1993/Illinois Issues/19 tive elections in Illinois: the role of legislative leaders," Illinois Issues, December 1991.)
The leaders of each of the four party caucuses in the
legislature have become the critical coordinators
and financiers of legislative elections through the
political committees and staff they control. However, the
role of legislative leaders and their campaign organizations
is not the whole story of cash and campaigns. Interest
groups in Illinois invest heavily in legislative campaigns,
both through direct donations of money and in-kind contributions of campaign staff, media ads, campaign literature
mailings and voter contacts. A preliminary review indicates
that interest group spending on legislative elections in 1992
20/June 1993/Illinois Issues was up by 50 percent over spending in 1990. For example, the Illinois State Medical Society provided over $88,000 of in-kind contributions to David Deets, a physician who was the incumbent Republican candidate in the 73rd House District. The House Republicans also contributed $54,000 of in-kind services to his campaign. The House Democratic leadership countered with direct contributions and in-kind services worth $112,000 to the Democratic candidate, Pennie von Bergen Wessels, who won a slim 378-vote victory in a district that leaned Republican and was counted as a Republican sure bet in most pre-election analyses. The value of savvy campaigns and effective spending was also evident in the 99th House District where the campaign of Bill DeMarco never really took off. When the voters and the local media began focusing on the fall elections, his difficulty in articulating why he should be elected and what he would do if he won created an opportunity for his opponent. In contrast, Moseley picked up attention and local endorsements through a more focused campaign.
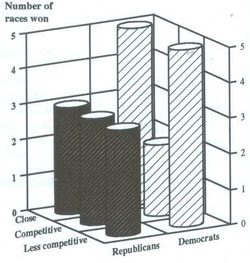
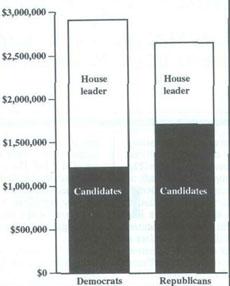
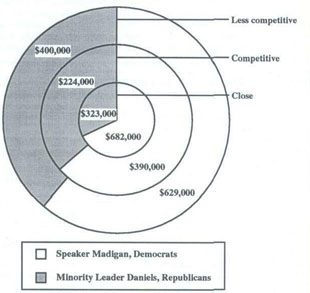
Contests in the 103rd, 104th, 73rd and 99th districts where Democrats won three of the four were among those 21 districts targeted by legislative leaders as crucial for control of the House. Spending by the candidates in those 21 races totaled $5.6 million. With a few exceptions, these were the most expensive House races in the 1992 election. Not all the spending was in close races. Both sides made some of their largest investments in races where they had incumbent legislators lose badly (the 77th and 104th for the Democrats and the 35th and the 80th for the Republicans). Total spending was approximately equal between the two sides; Democrats enjoyed an advantage of $231,000, or $11,000 per race. The most significant difference in the spending patterns in the targeted races was found in the proportion of the spending which came from the legislative leaders. Resources contributed by the Democratic leadership accounted for 58 percent of the total spending by Democratic candidates in the targeted races, while contributions and in-kind services from the Republican leadership accounted for only 35 percent of the spending by Republican candidates (see figure 2). Democratic leaders spent more than $1.7 million; Republican leaders contributed $947,000 to their candidates. The average leadership contribution to Democratic candidates in the 21 targeted districts was $81,000, compared to an average of $45,000 for the Republican candidates (see figure 3). This general pattern was even more pronounced in the eight targeted districts where the outcome was close. In those districts, overall spending was equal between the parties, but the Democratic leadership's share was 68 percent, more than double the Republican leadership's 32 percent share of spending in those races. The average legislative leader contribution to Democratic candidates was $85,000, while the average for the Republican candidates was $40,000. Six of the eight close races were not predetermined battles; rather, they became target races during the campaign. Of those six, the Democrats won four. The importance of the timing and the focusing of spending was again clear, with the advantage going to the House Democrats. Given the 1992 results in the races in the 99th, 104th and 73rd legislative districts, it is not surprising that the early line on the 1994 House elections is that Vickie Moseley, Laura Prussing and Pennie von Bergen Wessels will be among the top targets of Republicans as they seek to seize control of the House from Democrats. But Moseley, Prussing and Wessels will then be incumbents with all of the advantages that holding office brings. The map will still favor Republican candidates in the districts they represent, all things being equal. However, the primary lesson of the 1992 election in the House may be that things are rarely equal. Good candidates, smart campaigns and a lot of help from a savvy legislative leader should continue to be more important than the boundaries on a map in determining who controls the Illinois House. Kent D. Redfield is associate director of the Illinois Legislative Studies Center in the Institute of Public Affairs at Sangamon State University, Springfield. He is also professor of political studies. His ongoing research involves campaign finance and expenditures in Illinois, focusing on the General Assembly.
June 1993/Illinois Issues/21 |
|
|