 |
Home | Search | Browse | About IPO | Staff | Links |
|
Home | Search | Browse | About IPO | Staff | Links |
|
Underneath It All
BY GARY THOMAS "We're trying to promote smart growth, and understanding the state's geology is the first step in promoting smart growth." With that statement, Dick Berg launched into a conversation to convince me that doing a three-dimensional map of the entire state is the first step in putting together the information necessary for the smart growth he is promoting. It didn't take much convincing. He was armed with tons of statistics supporting his view, and the project made a great deal of sense to me.
Berg is a geologist and director of the geological mapping program for the Illinois State Geological Survey, the agency which, among other things, serves as the focal point for the state's mapping efforts. What he was talking about is the Central Great Lakes Geologic Mapping Coalition, an effort of the geological surveys of four states—Illinois, Indiana, Michigan and Ohio—and the United States Geological Survey, to begin the process of developing three-dimensional maps, from land surface to bedrock, to deal with issues of land use. "This mapping effort isn't just for business or government," Berg continued. "We're concerned with the quality of life for people. This is about where business and industry can be located, where development can take place, where we can build recreation areas. We're mapping the way to economic growth and, just as importantly, for environmental security." The mapping will be done at a detailed scale of 1:24,000, where one inch on the map is 2,000 feet on the ground. Don't look for the job to be done overnight. Even if maximum funding was available right now, the project would take upwards of
eight to nine years to complete. And that's just the initial phase of the project, comprising only about one seventh of the state. As you can see, mapping the entire state is a long, long-term project. Let's go back for a minute. Let's start at the beginning. Most of Illinois was shaped by glaciers during the past million or so years. These sheets of ice advanced and retreated across what would become Illinois, leaving thick, complex blankets of intermixed layers of mud, clay, silt, sand and gravel, dictating our agricultural soils, and the location of groundwater in aquifers and minerals. Three-dimensional maps will do more than just give us a look at our state from surface to bedrock. They will sort out and interpret the data, and highlight the areas that are subject to flooding, erosion, landslides, radon gases and earthquakes. The maps will point out where sedimentation is taking place and where water contamination is likely to occur. And while maps can't stop these natural events from occurring, the knowledge will provide the basis for locations where smart development can most beneficially occur while protecting and ensuring environmental preservation. This knowledge is needed for making the right decisions for a growing society. Keep in mind the decisions are going to be made, whether the information is available or not, Berg pointed out. And many times, the decisions are bad choices. "In the early 1990s, about $85 million was spent to develop a low-level radioactive waste disposal facility in Clark County," Berg said. "However, they discovered they were planning this site above an aquifer that could have allowed potentially contaminated materials to spread. So after all those dollars were spent, nothing came from the project. If we would have had detailed three-dimensional maps prior to site selection, we would have known that an aquifer existed and would never have considered the site for such a facility." The same is true with Superfund sites. Berg said the average cost of cleaning up a Superfund site is about $15 million, but that many of them wouldn't have been located where they are had we known what was beneath them. There are numerous other examples of bad decisions being made because detailed information was not available. "It's impossible to always make the correct decisions as to how to use the state's resources," Berg said. "The more information we have, the better we can plan. Three-dimensional maps will tell us what lies beneath and provide the background so informed decisions can be made. They will let us know where to build and develop, where we can dispose of our trash, where our aquifers are located and where the possibility of erosion or earthquakes is the greatest. Maps will also support timber industries and help protect fisheries and wildlife habitat."
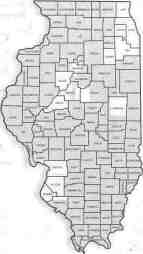
The Geological Survey plans to focus its initial efforts on the Chicago, East St. Louis and Peoria areas, primarily because that's where the majority of our population lives. "That doesn't mean we're not interested in all parts of the state," Berg said. "We just had to start somewhere, so we chose to begin in those parts of the state where the most impacts have already taken place and where planned growth is imminent." The initial effort will map all of 10 counties—Cook, DuPage, Grundy, Lake, Madison, Mason, Monroe, Peoria, St. Clair and Will—plus parts of eight others— Champaign, Jersey, Randolph, Marshall, McLean, Putnam, Tazewell and Woodford counties. When the
mapping of all these areas is complete, about one-seventh of the state will have been documented. The information won't come cheap. Berg said each of the four states is looking for federal funding to help with the mapping. He said the survey would require from $2 to $4 million per year for the next 10 to 15 years to complete the initial phase of the project. What's the value of this mapping effort? In the 1960s and 70s, the United States Geological Survey conducted detailed mapping of the entire state of Kentucky at a cost of about $90 million (in 1999 dollars). However, those maps simply showed primarily geologic materials at the land surface. They did not show all the materials from surface to bedrock as is being proposed here. The prima-
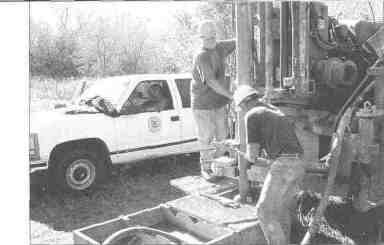
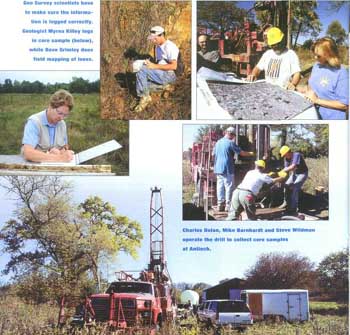
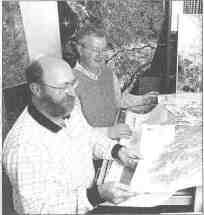
James Wade, Mike Barnhardt and Ardith Hansel check an ariel photograph during the mapping of the Antioch quadrant (below). The drill rig and other field equipment are moved into place to begin work at a mapping site in the Antioch quadrant (bottom).
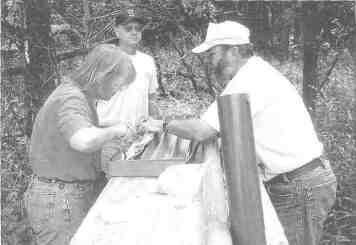
Geo Survey scientists have to make sure the information is logged correctly. Geologist Myrna Kiley logs core sample (top left), while Dave Grimley does field mapping of loess (top center).
ry use of the Kentucky mapping was to be for energy and mineral development. However, the main use wound up being for water resources and environmental protection. Illinois recently did a study to find out the economic importance of the Kentucky mapping. Berg said the study concluded that the value of the maps to users was between 25 and 39 times the cost of doing the mapping. He believes what we're proposing today will be even more useful and valuable than the mapping done in Kentucky. We've pointed out what the mapping would do and why it is important to Illinoisans, but the mapping of Illinois and other Great Lakes states also is important from a national perspective. The states include nearly 20 percent of the nation's land, and about 15 percent of the country's population. The states contribute half of the nation's heavy industry, one-third of the nation's corn and bean production, and include five of the 25 largest cities in the nation. "This is America's heartland, one of the most productive and economically important regions of the country," Berg said. "It's important to know about our geology for development, transportation and agricultural reasons." If this project is so important, why wasn't it done long ago? That question can be answered with two words: expense and computers.
The Illinois State Geological Survey has always had the ability to obtain some of the information necessary to put this mapping program together. However, obtaining all of the needed information is very expensive. Drilling holes several hundred feet deep and obtaining samples as well as geophysical investigations (sending sound waves and electrical curents through the earth to detect differences in their rates and ease of travel) do not come cheaply. In addition, hundreds of thousands of bits of information must be compiled in order to assemble the information into maps that are easy to understand. It wasn't until computers became readily available that the Geo Survey finally had the means of assembling and putting the information together into comprehensive maps. "Geology is the foundation for ecosystems," Berg said. "The makeup of the land determines what you can do there—everything from how many animals can live there to how much development the land can sustain. Mapping this foundation will provide us with valuable information that will become a part of our culture. Once available, it often will be taken for granted, but it will become important for industry, for developers, for agriculture and for individual landowners. "This is important information, and making decisions will become a whole lot easier when this information is available, whether it's being used to place a factory or a recreaction area.
|
|||||||||||||||||||||||||||||||
|
|