|
Home | Search | Browse | About IPO | Staff | Links |
|
Home | Search | Browse | About IPO | Staff | Links |
|
The Illinois Country became part of the United States when the Virginia militia, led by George Rogers Clark, surprised British garrisons in the Mississippi Valley during the War for American Independence. The Treaty of Paris at the end of the war confirmed that Illinois belonged to the new nation. In the process of setting up a government for the United States, various states ceded their western lands to the central authority. Thus the area north and west of the Ohio River became a separate territory under the control of the United States.
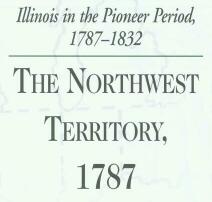
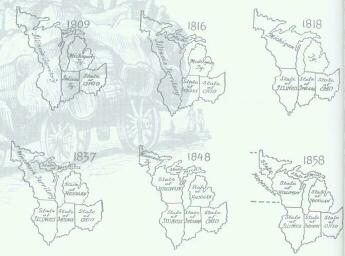
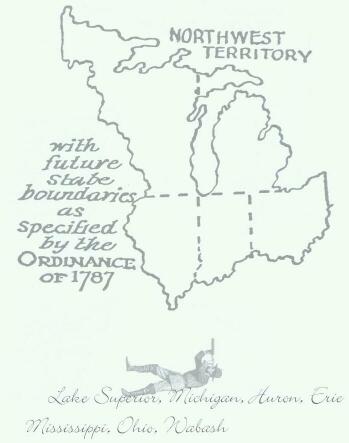
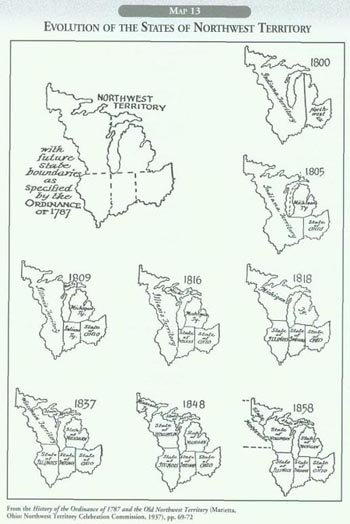
In 1787 the Congress under the Articles of Confederation, meeting in New York at the same time that the Constitutional Convention was meeting in Philadelphia, passed the Northwest Ordinance to provide for the future government in the area. Although it did not name the new states, it specified that there would be between three and five states in the region. It also set their boundaries. In addition, it prohibited slavery in the area, made provisions for public education, established freedom of religion, described an orderly mechanism in which the land would be purchased from the Indians, filled up with pioneer settlers, and gradually turned into a new state. The complete process took seventy-one years, but Illinois reached statehood in 1818, less than halfway through the territorial history. Reading the Map Every map needs a date because it presents a snapshot, a frozen picture, of one moment in the active life of the earth's surface. To show change over time on a map is difficult because a flat sheet of paper must show conditions at several different times. This requires an active imagination and careful attention on the part of the reader. One way out of this difficulty, especially for complex developments, is to use a series of maps, each one similar in design, to record and date the changes. Thus a sequence of nine maps is used here to tell 32 the story of how the Northwest Territory was divided into American states. Reading the series of maps demands several distinct processes. First, one must understand the geography of the initial map. In this case, it is a simple outline map without any names to identify its features. Secondly, the reader must put the maps into chronological order, noting the passage of time between each map in the series. Finally, the student must compare each map to its predecessor to note the changes that took place between one date and the next. Working with the Map The cartographer drew the first map in this sequence in a larger scale to help readers grasp the basic geography presented in outline. Students should readily perceive that the map utilizes two fundamental elements in describing the physical geography of Illinois: the Great Lakes and the Mississippi River system. Both are shown only in part, but they define the boundaries of the Northwest Territory. The only other feature on the map is the subdivision into five states as called for by the ordinance.
Students might work with the first map by naming the key places: Lakes Superior, Michigan, Huron, and Erie; the Mississippi, Ohio and Wabash rivers; and the eventual names of the states that occupied the territory. The first map might be enlarged to a full sheet on a copy machine to give ample room for readers to label and decorate it. If a hometown is placed on the map, nearly half of the students in Illinois will be on or beyond the state's northern boundary as set in the 1787 legislation. To see how things changed over time, students must push this map with its proposed boundaries into the currents of history. The sequence provides an opportunity for students to work with time in a simple, but fundamental way, putting things in chronological order. If the individual maps are cut out and pasted on 3-by-5 inch cards, the activity becomes a hands-on learning experience. More mature students can be challenged in the same way if teachers leave the dates off the cards and ask them to "calendar" the documents, using the professional language of an archivist. A list of the map dates on the chalkboard will help these advanced students tie the development of the Old Northwest to American history generally. Teaching the Map A discussion of dates, their importance on documents, and their use to put things in chronological order would be a good way to introduce this sequence. The maps here originally appeared in a pamphlet for school use published by the Northwest Territory Celebration Commission in 1937. Teachers wanting to develop a lesson on the Northwest Ordinance should be aware that a Big Ten University commemoration of its bicentennial produced a well-illustrated publication that can be found in many local and school libraries: Liberty's Legacy: Our Celebration of The Northwest Ordinance and The United States Constitution (1987). For teachers, a good account of the American Revolution in Illinois is George Rogers dark and the Winning of the Old Northwest by Robert C. Alberts, a pamphlet first issued by the National Park Service in 1975 and often reprinted. 33
34
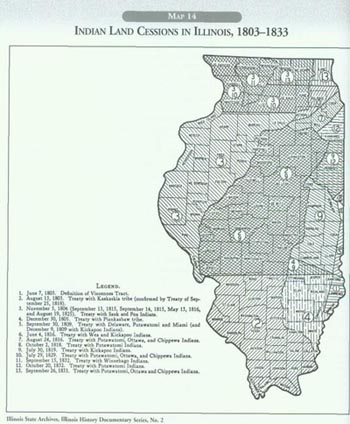
The Northwest Ordinance of 1787 spelled out the process by which the Illinois Country could become one of the United States. The process could begin only when the Indian titles were extinguished. Only then could counties be established, land divided and sold, pioneer farms laid out, and towns founded. Treaty-making with the Native American nations, however, was a function reserved to the United States government, as was the division and selling of the land. In Illinois, these processes took decades to complete. They occurred at different times and under various circumstances in the respective parts of the state. Maps provide a helpful way for students to envision the process by which Indian lands and settlements became white farms and towns, a process that defined the pioneer period of state history at the same time that it created a tragic era for the Native Americans. Reading the Map This is really a simple map, but to understand it one must realize that the modern counties are used only for reference purposes. The county names and boundary lines help readers locate particular places, such as the location of their school, on the map. Then the various shadings divide the state into parcels of land, each of which was acquired by a particular treaty. In many cases, several treaties were needed because more than one Indian group had a recognized claim on the land. The numbers on the parcels guide the reader to the name and date of the treaty, as well as the Indian tribes that signed the document. This is a generalized map and, as such, does not take into account two types of land ownership that are also part of the pioneer story in Illinois. The land owned by the French settlers in Illinois was confirmed by the Treaty of Paris which ended the War for American Independence. These French settlers became the first citizens of the United States in Illinois. Their land titles were legally defined and recognized by the U. S. government apart from the Native American land cessions. Also, in some cases, the Indian peoples "reserved" certain tracts of land from the cessions. These reservations remained Indian lands until they were sold to other people and thus were "ceded" by a different process. No Indian reservations remain in Illinois. Working with the Map
The numbering system puts the various treaties in chronological order. Thus, if students color each tract in sequence, they will readily perceive the general pattern of how the pioneer period began in Illinois: first in the south, then in the northwest, and finally in the northeast. Using different shades of one color could portray the process decade by decade, with 1800s one color, the 1810s another, and so on. The midway treaty in the chronological sequence, number 7, dated August 24,1816, secured the key linkage between the Illinois River and Lake Michigan. Note that it occurred just before statehood and was probably a key factor in pushing the final boundary of Illinois further north when statehood was granted in 1818. Teaching the Map The map provides opportunities to teach about the local tribes that lived in the various areas of the state at the point of contact. But this map, which presents an orderly process, and even suggests an inevitable transition, obscures a major theme of American history: the often-violent displacement of native peoples. The tragedy of lost homes and forced exile, as well as the battles and massacres that preceded the treaties—all these darker aspects of Illinois history are avoided on the map. This is another type of "cartographic silence" that alert map-readers will want to recognize and correct. Teaching the map certainly would involve helping students to see things from the Indian point of view. One place to get started would be Black Hawk's autobiography, written at the very end of the land cessions, "10th moon, 1833." This classic work is available in a modern paperback edition; Donald Dean Jackson, ed. Black Hawk: An Autobiography (Urbana: University of Illinois, 1990) provides a helpful introduction and bibliography. The map of Indian land cessions is from the Illinois History Document Series, number 2, published for teachers by the Illinois State Archives. Be sure to use your school's library or learning center to check out these valuable teaching resources. 35
36
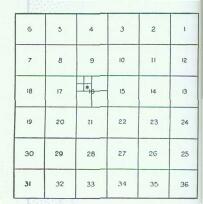
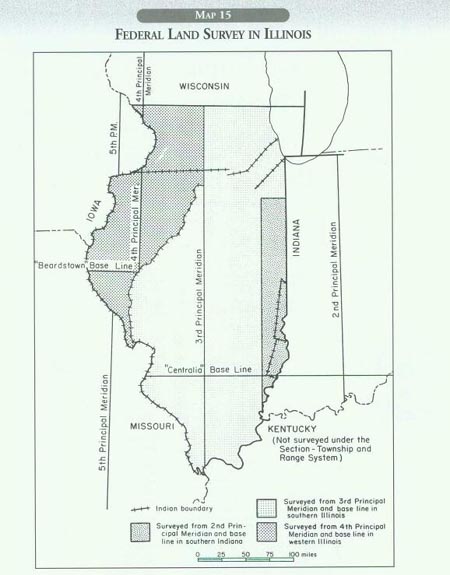
Once the Native American claims on the land had been transferred to the United States government, the property became eligible for sale through the General Land Office. Before the land could be sold to individual owners, it had to be surveyed, marked on the landscape, and described according to a system of townships and sections originally prescribed in the Land Ordinance of 1785. This legislation, passed two years before the Northwest Ordinance, required that the land be divided into rough squares, six miles on each side. These larger units were called townships because it was thought that an ideal agricultural community would be about this size: everyone in a 36-square mile township could walk to the center of the community, attend a meeting, and return home the same day. Thus the townships were considered to be ideal building blocks for a democratic government. Many still function as civil townships, school districts, and rural voting precincts. The major function of the surveyor's townships, however, was to turn the raw land into a commodity, something that could be easily described, located, bought, and sold. To meet this objective, the Land Ordinance of 1785 called for the division of townships into 36 sections, each about one mile square. Each section then contained 640 acres, the expectation being that four or more individual farms would take up one section. In pioneer times, a 40-acre farm was about the most land a family could cultivate relying solely on their own labor. A 160-acre farm, it was thought, would provide ample room for an original farmstead, adjacent land for children or tenants to work, and some reserves for woodlots and pastures. Eventually, when every family (of say five members) would have its own farm of 40 acres, each 160-acre parcel would support about twenty people. Since a section was made up of four of these units, a fully developed rural community could have up to eighty residents per square mile. The township in a rural area would therefore have a maximum population of 2,880 citizens (36 x 80). Reading the Map The system developed by the General Land Office for dividing the land in Illinois started with a point establishing a principal meridian, an imaginary line running due north from the mouth of the Wabash, Ohio, or Illinois rivers. A point was then selected along the meridian to establish a base line that would cross the meridian at right angles, thus running due east and west, paralleling the equator. The townships would start at the major intersection of the base line and the meridian, numbering so many ranges east and west of the set meridian and so many townships north and south of the base line. When students read this map, they should realize that almost all parcels of land in the state are accurately described by starting at a meridian and a base line, the only exceptions being former Indian reservations or parcels in old French settlements. Note that most of the land in Illinois is described by a spot near the city of Centralia, which pointed to the mouth of the Ohio River. Working with the Map There are lots of ways that students can work with this map, starting with names made meaningful by the land survey system: Centralia, the Illinois Central Railroad, and Meridian Road (a name that is used in many locations, in Rockford, for example). Indian (land cession) boundaries are important because they limited where land could be surveyed until all Indian land claims were fully extinguished. The best way to work with the map, however, is to note that two scales are suggested—one in a common scale of 100 miles (at the very bottom of the map) and the other set by the surveyors in multiples of 6 miles, or about 16 2/3 townships in the same 100 miles. If students locate their community on this map, they can measure the township (north and south) and the range (east and west) of the appropriate base line and meridian. A visit to a local realtor, bank, or local governmental office could be used to check the measurement. In proper terminology, using the land survey system to locate and name real estate is to give its "legal description." To help students through the complete system, a township with its numbered sections is shown on page 38. 37 Teaching the Map
The land survey system gives much of the United States the typical checkerboard look from an airplane because the section lines were used for roads, field boundaries, city streets, and urban subdivisions. Midway Airport in Chicago, clearly evident on maps and aerial photographs, encompasses one section—number 16—measuring a mile on each side.
All real estate that was once federal land Has been surveyed, described, and sold under the federal (often called the Congressional) system. Note that Kentucky on our map carries a note that it was not surveyed under this system because it was created from lands that belonged to Virginia that were never ceded to the United States. For a well-illustrated discussion of the Federal Land Survey in Illinois, see David Buisseret, Historic Illinois from the Air (1990), 48-49. 38
39
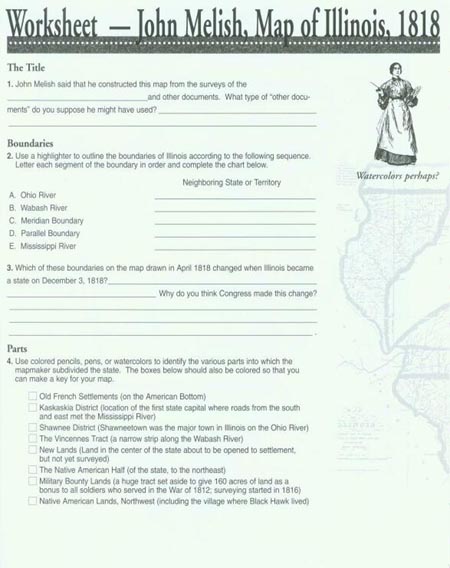
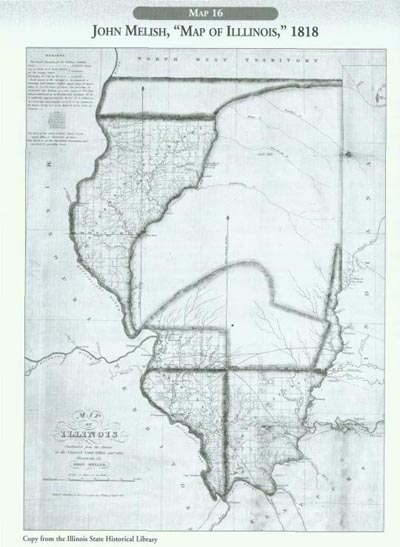
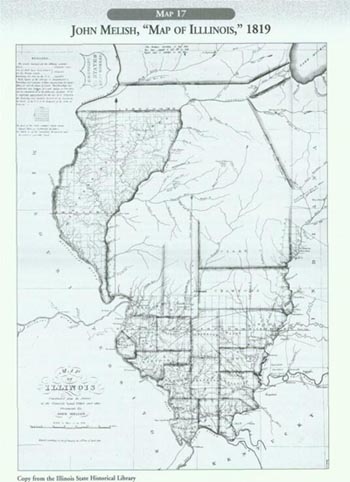
John Melish compiled a large map of the United States in 1816 that soon became one of the classic maps of the nation. To aid travelers and others, he published at the same time a Geographical Description of the United States... an Accompaniment to Melish's Map. He realized that a set of state maps, drawn from actual surveys, would make his large map even more valuable. He used the General Land Office records to produce a single-sheet map of Indiana in 1817 and followed it with maps of Illinois and Alabama in 1818. He was forced to revise all of these maps within a year or two, as the process of surveying and settlement quickly dated the old issues. In the case of Illinois, his two maps demonstrated how much difference a year could make. The cartographer's death in 1822 cut short his plan to publish an American atlas, which would have been composed of his large map of the nation, cut into parts, plus a section presenting each state individually. Melish's 1818 map anticipated how Illinois would appear when statehood was granted. The 1819 revision, however, pictures the state as it actually turned out. Comparing the two not only introduces students to the comparative approach to map reading, it also teaches them a major lesson in state history. Reading the Maps The best way to orient oneself when reading a map of Illinois is to first locate the Mississippi River, Ohio River, and Lake Michigan. Next, trace the courses of the Wabash and Illinois rivers. Then check the meridian and the parallel that complete the state's boundaries with Indiana and Wisconsin. At this point one would have a pretty good grasp of Illinois geography. Melish's 1818 map, however, frustrates such a survey by omitting Lake Michigan, distorting the Mississippi River above Rock Island, and using the proposed northern boundary as set by the Northwest Ordinance. Using the Land Office Districts as subdivisions for the state instead of counties, the 1818 map takes on a strange appearance. One year later, however, the 1819 map, although quaint to a modern student's eyes, does start to put things into a recognizable perspective. Lake Michigan is reassuringly present, the Rock and Fox river valleys anchor the northern reach of the state, and the counties set by the new state start to appear, structured in large part by the townships of the land survey. Congress wanted to make sure that Illinois would remain a free state to balance the claims of Missouri, which was about to seek admission to the Union as a slave state. The congressional solution was to move the boundaries of Illinois far enough northward to give it a strong presence on Lake Michigan. Illinois thus became a Great Lakes state, tied in some measure to New York, which was then digging the Erie Canal to bring the commerce of the Great Lakes to the Atlantic Ocean by way of Buffalo, Albany, and New York City. Both maps highlight how much of Illinois remained closed to pioneer settlement because Native Americans still occupied the land (see Map 14). Black Hawk's village near the mouth of the Rock River would continue for another dozen years (see Map 19). Map 15 on the Congressional Land Survey in Illinois is also relevant because the Land Office supplied the geographical details for Melish's productions. Note how both maps seem to focus on the areas of the state that had been surveyed, outlined by the grid lines set six miles apart.
Working with the Maps Two worksheets are provided to help students work with each of Melish's maps individually. Teaching the Maps These are examples of political maps because they emphasize the boundaries of the state and its political subdivisions. Teachers will want to explain how such boundaries are the results of political decisions. Why would the U.S. Congress in 1818 move the Wisconsin boundary of Illinois so much further to the north than established by the Northwest Ordinance? Comparing the maps shows how things change over time. Change is the mainspring of history. History, in turn, is the discipline that attempts to understand and explain how and why changes occur. The set of Melish maps thus opens the door to a discussion of what history is all about. Historians are convinced that the better we grapple with change, the more we will grow as human beings. 40
41
42
43
44
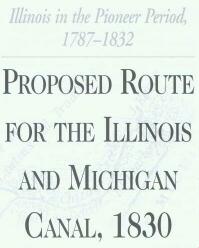
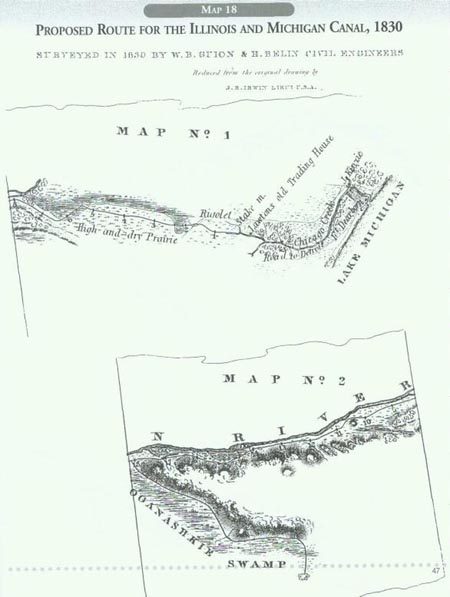
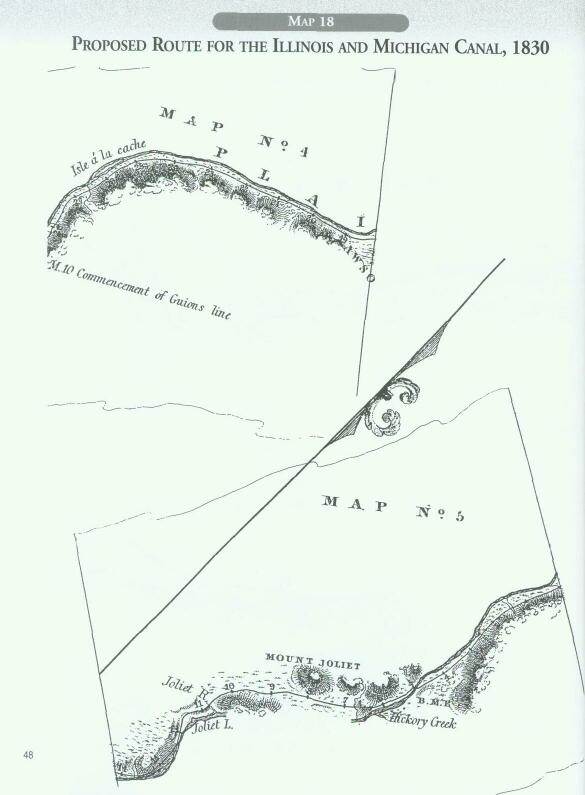
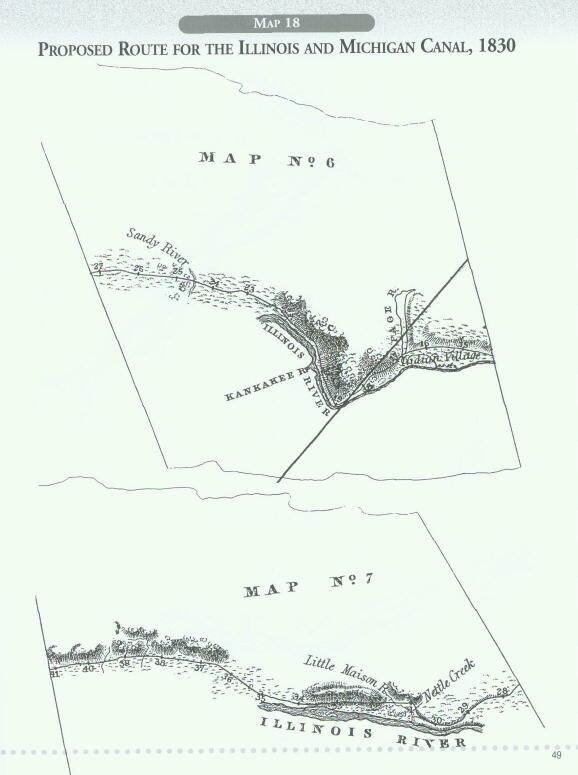
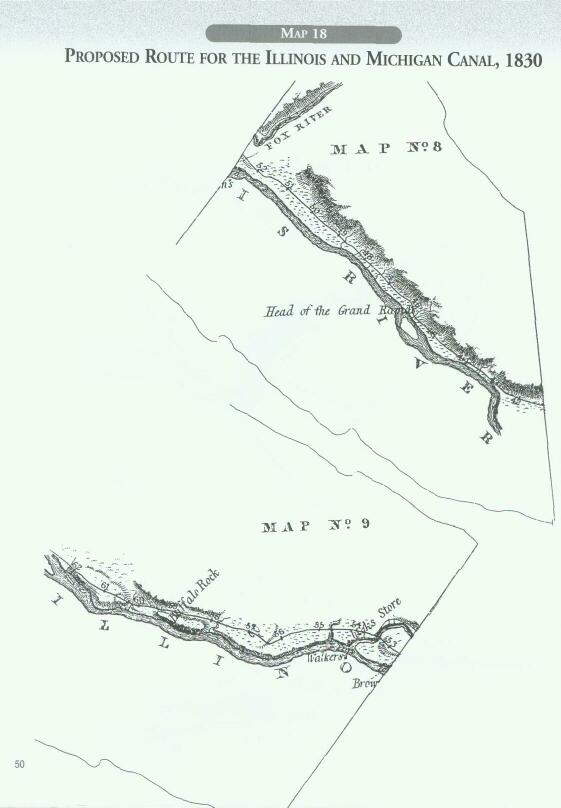
Illinois is both a Great Lakes state and a part of the Mississippi Valley. Its two geographical parts are tied together by a major transportation corridor. The first Europeans to visit the area, Jolliet and Marquette (see Maps 9 and 10), both commented that the portage between the Illinois and Chicago rivers would someday be a canal linking the waters of the St. Lawrence in Canada with those that flowed southward toward the Gulf of Mexico. "Proposed Route for the Michigan and Illinois Canal" was one of the first maps to picture this route in detail. This map, published as a government document in 1830, records the route surveyed by two civil engineers, W. B. Guion and E. Belin. Their field drawings were consolidated and reduced by Lieutenant J. R. Irwin of the United States army. The printed version put these maps together in a fold-out that also carried a profile of the land along the route, using the surface of Lake Michigan as the starting point. The Bench Mark ("B.M.10") on Map 4 marks the point where the land starts falling beneath the lake level, declining almost 131 feet by the end of "Guion's line." East of this bench mark the route rose to a height of only 17 feet above the lake level (at mile 24). The profile makes it clear that most of Illinois lies below the level of Lake Michigan. The moraines that ring the lake serve as a dam holding back the waters of the great glacial lake. Reading the Map
To read this map, one must first put its parts together in the mind, seeing it as a chain tying together the Great Lakes and the Mississippi Valley. The proposed canal reaches across a mid-continent divide to connect the "Chicago Creek" with the Illinois River. Since the map itself is composed of a series of links, the image of a chain is particularly appropriate. The map's message will become crystal clear as the parts are cut out and physically connected on a desk or table. Then reference should be made to maps of the entire state, nation, and continent, so that the national importance and continental scope of the map will come into full view. The individually numbered map segments also present some interesting details in their own right. Map 1 shows Fort Dearborn and the extensive vegetable gardens of the fort's sutler. It also notes Lawton's old trading post, the road to Detroit, and Mud Lake outlined north of a "high and dry prairie." Maps 2 and 4 (Map 3 is not part of the sequence) identify the Plain River (Des Plaines) and the Oganashkie Swamp (Saganashkee Slough). The bluffs pictured on every map segment define the edge of the old spillway that drained melt waters as the glaciers retreated. Mount Joliet on Map 5 is an isolated part of these cliffs, surrounded by the flood plain. An Indian Village is located near the mouth of the [Du] Page River (Map 6) and above Grand Rapids located downstream (Map 8). Some stores and pioneer cabins appear at the mouth of the Fox River five miles from Buffalo Rock, a landmark which is now a state park. All of these features can be readily located on a modern state highway map. 45 Working with the Map After students cut out the various segments, they can paste or tape them together, taking care to align them properly. The fancy directional signal on Map 5 points to magnetic north so that compass readings in the field could be easily translated on the map. Today, students can use it as "due north" to orient the assembled map. This will make it easier to find the proposed canal route on a modern state highway map. Additional maps, such as one of the Chicago area, will help students see the canal route, or the former glacial spillway, as a major transportation corridor. The Santa Fe Railroad, Historic Route 66, Interstate Highway 55, and the Sanitary and Ship Canal all use this linkage between the lake and the river. To help students connect this old map to today's maps and landscape, the following reference points may be helpful:
• Map 1. Lawton's Trading Post was near Ashland Avenue in Chicago; Harlem Avenue is between mile 6 and 7
Teaching the Map If the map segments are enlarged, they could form a nice centerpiece for a bulletin-board display. Contact the National Park Service and the I & M Canal Association for literature and other information. A splendid guide to the corridor's history and resources is Michael P. Conzen and Kay J. Carr, eds., The Illinois & Michigan Canal National Heritage Corridor (1988).
46
47
48
49
50
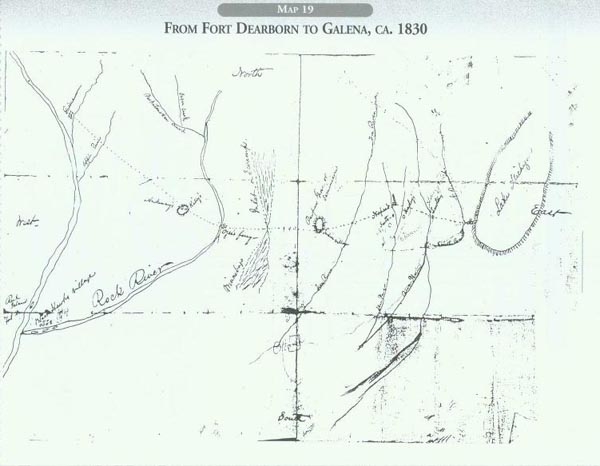
This is a manuscript map much like the one drawn by Father Marquette about one-hundred sixty years earlier (see Map 8). In this case, the mapmaker and the specific reason for the map are unknown. But the map may have something to do with the Black Hawk War because it is filed with other such documents in the National Archives in Washington, D.C. (Records of the War Department, Office of the Adjutant General). It was printed in Wayne C. Temple's Supplement to Sara Jones Tucker's Atlas: Indian Villages of the Illinois Country (Illinois State Museum, 1975). A comparison with Marquette's map makes a lot of sense because the 1830 document connects two major features used by the French missionary explorer: the Mississippi and Chicago rivers, while filling in some of the space left blank on the seventeenth-century drawing. A date of about 1830 is assigned to the later map because of the features it records. However, a close inspection of the map reveals that some details were lightly sketched in, perhaps by a different hand at a later time. Reading the Map
Since this map has no title, caption, or key, it may be quite challenging to students. Lake Michigan is the largest feature on the map, so readers might start there. Then they will notice that the mapmaker has noted the cardinal directions on the map: east and west, north and south. The large river at the western edge of the map is not identified, but we do get some big hints: the Rock River flows into it near Rock Island and Black Hawk's village. A perusal of the document will soon reveal that most of the lines on the map are the rivers that one would cross on a journey between Lake Michigan and the Mississippi River. The dotted line, probably the reason for the map, is a conventional symbol for a route or a trail. Did someone make this sketch to give directions to a traveler or to record a journey? We therefore made up a title for the map, something like "From Fort Dearborn (at the mouth of the Chicago River) to Galena" (near the Mississippi River). Other evidence on the map helps us assign a date of about 1830. Note that Ogee's ferry carried travelers across the Rock River. Joseph Ogee, a French Canadian trader, built a tavern and ferry on the Rock River in 1828. He sold it in 1830 to John Dixon, who laid out the town that now carries his name. The date of 1830 would put the map on the eve of the Black Hawk War. The warrior's village is named at the lower left and designated by seven circles. Circles are conventional symbols for settlements on maps, and they also appear at Fort Dearborn (three circles), Galena (six), the ferry settlement on the Rock River (three), and various individual pioneer outposts with the names of the pioneers. These names are difficult to decipher, even on the original document. But two pioneers (Aukney and Kellogg) shared a grove west of the Rock River Ferry, We recognize the symbol for a grove of trees on the prairie because 51 Pawpaw Grove is labeled on the route just west of the Fox River. Note that an Indian village is located by this landmark, the home of the notable Indian leader called Shabbona. It is now a state park. One other place seems to have been added to the map on the fold in the south. This is Ottawa, identified by both a circle and a square. The circle designates a settlement. Would the square represent the "fort" that was hurriedly erected nearby during the Black Hawk War? Maps always raise questions. Working with the Map The map seems to call out for color. Make a key to designate watercourses, groves, prairie lands, and settlements. In the process, students can best work with the map by relating it to a current state highway map. Start by locating the mouth of the Chicago River, Galena, Rock Island, Dixon, and Ottawa. Then trace the route on the map westward, marking off the rivers crossed as one proceeds westward from Chicago: the Des Plaines (Aux Plain), Du Page, Fox, Winnebago Swamp, Rock, and Apple rivers. Teaching the Map The best preparation for teaching this map is to make the journey today, camera in one hand and a good guidebook, like the one in the American Guide Series (editions in 1939, 1947, and 1974) originally made by the Federal Writers Project of the WPA. One can figure out the closest modern route to the early pioneer trail by closely scrutinizing the map, or, one can take the Eisenhower Expressway west to Interstate 88 and then follow this East-West Tollway to Sugar Grove west of the Fox River. Stops at Riverside (Lawton's Trading Post on the Des Plaines) and south Naperville (Scottys on the map, a log cabin built by Stephen Scott in 1830) where Naperville Road crosses the West Branch of the Du Page River. At Sugar Grove, go west on U.S. 30 (the Lincoln Highway) with a stop at Pawpaw to visit Shabbona's Grove, in which his grave is located. At the junction with U.S. 52, proceed north and cross the Rock River at Ogee's Ferry. Just west of Polo is Buffalo Grove where John Aukney erected a public house in 1829 and the Kellog family moved in as neighbors in 1830. Stay on U.S. 52 until Mount Carroll, where Illinois 78 will take you on a scenic drive to U.S. 20 at Stockton. Proceed west on U.S. 20, crossing the Apple River, into Galena. The town before Galena—Elizabeth has a reconstruction of its fort erected during the Black Haw War. Note: This manuscript map is sometimes attributed to a French Canadian trader by the name of Du Pahze, who operated a trading post at the forks of his namesake river (Du Page). But why would he not put his own location on the map? In my view, it is better to treat the map as an anonymous document. 52
53 |
|
|