 |
Home | Search | Browse | About IPO | Staff | Links |
|
Home | Search | Browse | About IPO | Staff | Links |
|
By William D. Walters, Jr. Editor's Note: This essay is adapted from the introduction to the recently published The McLean County Combined Indexed Atlases, 1858-1914, a joint project of the McLean County Museum of History and the McLean County Genealogical Society. In the second half of the nineteenth century, American publishers discovered a market for a new kind of book: The county atlas. Bound books of maps had been available since the mid 1500s, and by the 1570s, English cartographers were producing detailed large-scale maps showing proper ownership. Even earlier, wealthy landowners had employed itinerant artists to produce pictures of their houses. However, putting these three elements together and selling the product to a mass market was something new, and something distinctly American. The result was the county atlas. These atlases now are regarded as a high point in the history of American cartography. For many of us, county atlases are among the most interesting and delightful artifacts of the past century, visually pleasing objects in their own right. Even in their own time, the maps were highly regarded. In the Midwest the county atlas quickly became a symbol of local achievement and a visible reminder that the rude days of the frontier had passed. The county atlas was a bold declaration that American farmers, and in particular, the farmers of some particular county, were now among the wealthiest in the world. By placing a gilt-lettered atlas on the parlor table that showed their own land, and perhaps even their own house, farmers were making a statement about personal achievement. They were publicly expressing great pride. A new class of farmers 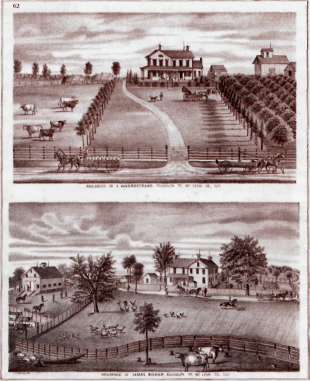
Since the colonial period, officials have demanded maps showing property ownership. Usually, these maps were produced by a professional surveyor using a magnetic compass and walking odometer wheel. Neither instrument was very accurate, but the results could be quickly corrected by roads, fences, and survey markers. These maps were reserved for official use, but some were printed and even sold by subscription. To show property ownership, a county map had to be quite large and therefore was easily damaged. By the middle of the nineteenth century, however, publishers decided it would be easier to print separate maps of each township and then bind them together. The Civil War trained many officers in the skills of mapmaking. Rural prosperity, especially in the north central United States, created a new class of farmers wealthy enough to afford such books. Publishers quickly learned that they could sell more atlases if they supplemented the maps with extras such as lists of subscribers, biographies, short county histories, and specially made illustrations. The early center of county atlas production was Philadelphia, but it gradually shifted west to Chicago. The American Midwest soon became the focus of county atlas production. Almost no atlases of counties in the South were made. Coverage of the West was spotty. The Northeast, which had been the initial focus of attention, slowly became less important. In contrast, many Midwestern counties soon had at least three or more atlases. The reasons for this concentration are easy to understand. The rigid system of township and range survey used in the Midwest made it easy to produce maps and show property owners. More important, by the 1870s, the states of the old Northwest had become the most prosperous agricultural area in the world. The sales pitch Norman J. W. Thrower, in his 1960 California Geographer article "The County Atlas of the United States," provided an excellent account of the county atlas business. The process began when a salesman arrived in the county and sought out the most important citizens. He would encourage these people to sign a contract, usually for about ten dollars, paid when the atlas was delivered. Using the names of these key people, the salesman would then canvas the county for additional subscribers. Soon a second wave of Illinois Heritage 25 salesmen would come knocking. Subscribers were told that for an additional thirty dollars the farmer could place portraits of their family in the atlas. A higher payment would bring a talented artist to draw pictures of the farmstead, to be added to the atlas. The 1870s atlas for Fulton County, Illinois, includes a picture of an artist. He is dressed in a smock and broad brimmed hat, looking as if he had just stepped out of a Paris salon. In the image he has carefully drawn the farmer's hogs. Several months later the atlas would be delivered to subscribers. Those who had not subscribed could buy copies for about five dollars. Thrower estimates that in the 1870s a county atlas might generate $20,000 in sales, double its production cost. Follow the grove Today, county atlases are immensely valuable not only to the rare book dealer, but also to the historian, genealogist, and student. These atlases open a unique window into Illinois' past. For instance, a close examination of a succession of McLean County atlases (1856, 1866, 1874, 1895, and 1914) tells us a great deal about how much of Illinois was settled. For one, it was not settled from east to west, but from grove to grove. Originally about 90 percent of central Illinois was tall grass prairie and the remainder timber. To survive, pioneers needed to quickly tap both environments. They would select land on the edge of one grove, do a little hunting, raise a little corn, and turn their cattle and hogs—ears carefully notched—out onto the prairie to graze. When the urge struck, they would travel across the intervening prairie and find new land on the edge of the next convenient grove. The system made great economic sense. By clinging to the margins of woodland, settlers had timber for fuel and building material. But pioneers were bound to trees in a more important way. All of Illinois was open range. Anyone's cattle or hogs could graze and feed anywhere—on anyone's land, and eat anything that satisfied their hunger. The only legal restriction was that fences could not be pulled down to permit grazing. The first step in growing anything was to fence out livestock. Stock raisers loved the law and corn growers hated it, but it was many years before the law was changed. Because most McLean County pioneers tried both to grow corn and raise livestock they had mixed feelings about the law, but they could not avoid its consequences. In other words, they needed lots of timber. The most important implication of the open range law was its impact on fencing. McLean County pioneers knew the prairie soils were first rate, but they couldn't farm until they had cut enough fence rails to keep the neighbors'—and their own—cattle out of the crop. Eventually hedge fencing was established and various sorts of wire fence systems would be developed, but for the first 50 years of the county's history, the only source of fencing material was nearby woodland. The atlases show that it wasn't just farms that clustered near the edge of woodland. Early roads often skirted the edge of groves, and every pre-railroad town in the McLean County, including LeBoy, Lexington, Saybrook, and Bloomington, was located along the line that separated timber from prairie. Many of these roads are shown on the county atlases. 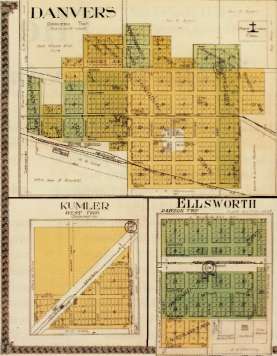
In the same way that early settlers avoided open prairie, they also avoided clearing fields from woodlands. Aside from the effort of cutting trees and the knowledge that woodland soils grew inferior crops, there was a more important reason. Woodland was simply too valuable to farm. Everyone needed a source of wood. Very quickly, every acre of timber was bought up and subdivided into tiny tracts. Some of these woodlots were bought up by neighboring farmers and some went to sharp-eyed speculators who knew that without wood the prairie could not be farmed. The striking difference in land division between timber and prairie can be seen on most county atlases, and remains evident on modern land ownership maps. Original woodland is minutely subdivided, often into lots of one to five acres; originally prairie was divided into large square tracts, anywhere from 40 to 160 acres. This pattern even influenced the location of twentieth century subdivisions, where developers found it easier to acquire the larger prairie parcels, as opposed to the much smaller timber parcels. As more and more land was taken up, farmers were forced further from the groves. The 1856 McLean County map shows the process of prairie settlement underway but still incomplete. By the time of the 1866 map, the transition to open prairie farming was almost complete, and last remaining large tracts of open prairie were broken for farming in the early 1880s. The railroad ended the hammerlock that woodland had on settlement. Cheap pine boards from Wisconsin and Michigan could be picked up at the nearest station for less money than board cut out of local woodlots. County atlases show clearly the evolution of railroads and of town location. With the new railroads came new towns, and these towns did not need to be near woodland. None of them grew by accident. These towns were as carefully marketed, fully sponsored, and heavily advertised as any modern real estate development. By the time 26 Illinois Heritage of the 1895 McLean County atlas, every township had at least one railroad, and each township had some sort of a town. This, too, was no accident. After the 1850s, almost all new railroads were funded by bonds; approved by township referendum with the condition that at least one station be located within the township. Each nineteenth century atlases offers a wealth of information. For example. The 1856 Map of McLean County (known as the "Folsom" map for surveyor Peter Folsom) is an unrivaled source of information on early roads. As the nineteenth century progressed there was a powerful movement to straighten roads in order to align them with property lines. In Folsom's time this process had just begun. Sensible pioneers found no reason not to travel by any but the most direct route. Since almost nothing had yet been spent on improving rural roads, there was little reason to follow any other route. Therefore the map shows a spider web of town-to-town routes. Other patterns are also evident. Many roads curved to follow the edge of the groves. In part, this was because prairie was easier to cross than timber, and in part because pioneer settlers liked to put their houses along the margin between timber and prairie. 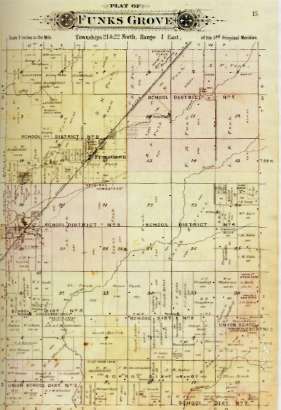
The 1874 Atlas of McLean County is the product of Warner and Beers, a Chicago firm that was one of the best-known producers of such books. Like similar firms, it sold its products by subscription. Agents traveled door-to-door taking orders. The 1874 atlas is far more elaborately produced than either of the two earlier maps. Each township has its own page surrounded by an engraved border. In addition to names of property owners, the location of each rural house is shown. Schools and churches are included. Detailed town plans are provided, and each new subdivision, or "addition," is shown. There are plans of all country towns that show the position of major buildings. Besides the maps the other impressive features include a table giving the name of each subscriber and the date that person arrived in the county. The glory of the 1874 atlas, though, is its detailed illustrations. By the 1870s, McLean County farmers were justifiably proud of their achievements and they felt a need to show what they had accomplished. Photography was expensive and difficult to reproduce, so many subscribers or patrons were delighted to pay a little extra to have an artist produce a picture of their factory or farmstead. The year 1874 came at the end of 20 years of great prosperity and the drawings are windows into this new wealth. They show details of barns and cribs, wagons full of corn or hauling massive loads of hay. Farmers were proud of their fences and these are shown in great variety and detail. The illustrations show other signs of wealth. We see plump cattle, chickens, flower gardens, ornamental trees, exotic birds, and newly planted rows of hedge plants. Many of the drawings feature buggies pulled up in front of the houses, where the artists could not fail to include them in the picture. Farmers are shown going about their daily chores or gazing with pride at elegant horses or clusters of stiffly drawn, but carefully dressed women. Most dwellings are shown in remarkable architectural detail, and comparison with later sources shows that these details were accurate. In addition to houses, the atlas includes fine drawings of factories, mills, and many of the county's newly built civic buildings. The 1895 atlas is the product of the Philadelphia firm, North West Publishing. It calls itself a "Plat Book," but it is nothing like the drab modern products. Here, the limits of groves are no longer shown, an indication that wire fence and imported pine lumber had at last replaced local timber. The growing importance of education is shown with the addition of school district boundaries. It also includes subtle clues to important change. In the countryside the 1895 atlas shows many of the brick and tile works. These manufacturers produced tens of thousands of clay drain tile, which completely altered the rural landscape. Township, range, and meridian In making good use of a county atlas, it helps to have a basic understanding of the language of land division in Illinois. Once you learn the basics of this system locating a land-holding is usually quite simple. The system adopted to identify land in Illinois stems from a problem that the U.S. government confronted in the 1780s. The federal government held vast amounts of land. The push of western settlement placed these lands in high demand. Therefore they had to be quickly and efficiently transferred. Moreover, this transfer had to be done in such a way that a small number of government officials could keep track of the exact location of every bit of land. Congress did what any present day distributor would do today: They put everything into boxes of a standard size. These boxes were squares six miles on a side called townships, and the whole system came to be called Township and Range. Illinois has some fascinating exceptions to the standard pattern. Remnants of French colonial surveys survive in the southern parts of the state, and there are curious squares in northern part of the state called "Half-Breed land," associated Illinois Heritage 27 with the retention of land by Native Americans. However, most of the state, and all of McLean County, have none of these exceptions and are entirely subdivided according to townships and range. The first thing to remember when viewing the system of land survey shown in the atlases is that the township and range system was established before present day county boundaries were drawn. Because of this, township and range numbers march across the land as if counties did not exist. The second thing to remember is that each of the six-mile squares, like all locations, need two elements for identification, one to tell distance north and south, and the other east and west. The whole system needed a base, from which lines could be drawn. In far southern Illinois an east-west line was surveyed and called the Base Line. North and south of the Base Line surveyors laid off parallel lines at six mile intervals. Each of these six-mile thick slices was given a township number, often abbreviated with the letter "T," together with an additional N or S to show if any particular slice was north or south of the Base Line. East and west direction was measured from one of several arbitrary north-south lines called Principal Meridians. The Third Principal Meridian, for example, runs from Cairo, at the southern tip of Illinois, northward to the Wisconsin border. Roughly 60 percent of Illinois is measured east or west from this line. Each stack of six-mile squares is given a range number, usually abbreviated "R" as well an E or W designation to show which side of the Principal Meridian it is on. 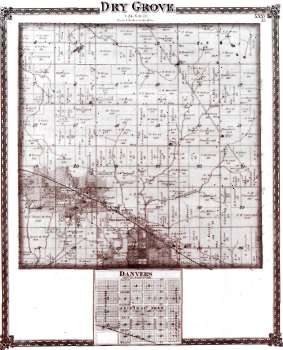
Of course, only the wealthiest purchasers could afford an entire 36 square mile square, which would have included over 23,000 acres. Therefore, each of the new six-mile squares was divided into 36 smaller squares called sections. The sections were then numbered zigzag fashion beginning with "l" in the northeast corner, going back and forth, until the number "36" was reached in the southeast corner. Each of these sections, in theory, included 640 acres. Differences in land subdivision shown in the atlases reflect differing periods of settlement. In McLean County, the decision of the Illinois legislature to use the word township to designate a small governmental subdivision created a little sectional tension. To New Englanders, the word "township" was not just a surveying measure, but a unit of government with rules, and budgets, and elected officials. They thought it should be the same in Illinois. Southerners found the notion of administrative townships a Yankee abomination, and they resisted the idea. In 1848 and 1849, Illinois law was altered to give counties the option of creating administrative townships. McLean County, for one, organized such townships eight years later. Most of these townships were the same size as surveyors' townships, and most corresponded with a single 36 square-mile unit. Today, only the lucky few can expect to own an original nineteenth century county atlas, for a great many have been lost. County atlases suffered more than other books. They were practical volumes, and heavily used. Copies of county atlases often contain penciled notes, calculations of field sizes, and sketches of revised boundaries. And since atlases were too big to fit onto ordinary book-shelves, many libraries regarded them as nuisances. Recently, a great many county atlases have been broken apart for decorative value, and individual map pages have become flea market finds. Illustrations commonly are framed and hung on walls. Maps of newly settled western states, which were often bound with Illinois county atlases, have become a particular attraction. Due to decades of neglect, misuse, and outright cannibalization, well-preserved and intact atlases are an increasingly rare find. For instance, if you are lucky enough to locate a tightly bound copy of the 1874 Atlas of McLean County, with all of its pages in good condition, don't be surprised if the asking price is more than $1,000. The county atlas also found its way into literature. Some writers scoffed at its efforts to make heroes of otherwise obscure country folk. Others however saw deeper meaning in the books. In his youth, nineteenth century county atlases fascinated the great and troubled Indiana author Ross Lockridge. He built his entire 1,066-page novel, Raintree County, around one man's search for a rumored version of the Raintree County Atlas. In the novel, the narrator discovered a drawing altered by an artist who the atlas publishing company failed to pay. Suffice to say, this fabled drawing showed farmers engaged in acts not commonly illustrated in atlases. At the start of the book, Lockridge informed his readers that "the clock on the Court House Tower of page five of the Raintree County Atlas is always fixed at nine o'clock, it is summer and the days are long." To Lockridge, this atlas, its maps, the county itself, and the life of Lockridge's hero are inescapably intertwined. William D. Walters, ]r. is professor emeritus of geography at Illinois State University. He is the author of The Heart of the Cornbelt: An Illustrated History of Corn Farming in McLean County, published in 1997. He is also the winner of the Pioneer America Society's Hemj H. Douglas Award. 28 Illinois Heritage |Home|
|Search|
|Back to Periodicals Available|
|Table of Contents|
|Back to Illinois Heritage 2007|
|