|
Home | Search | Browse | About IPO | Staff | Links |
|
Home | Search | Browse | About IPO | Staff | Links |
|
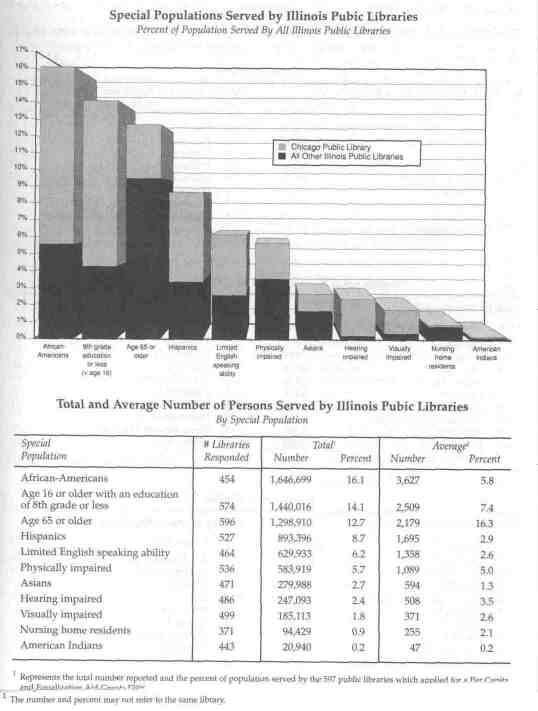
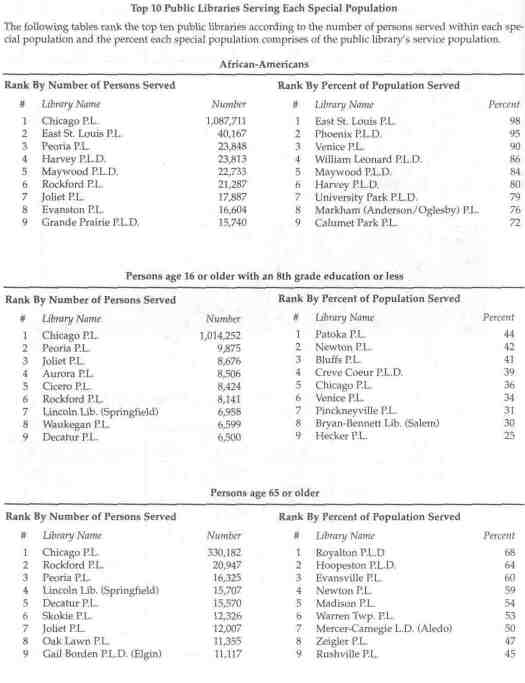
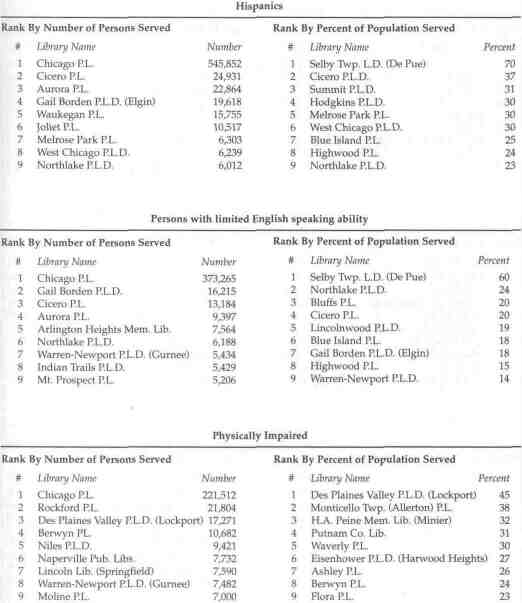
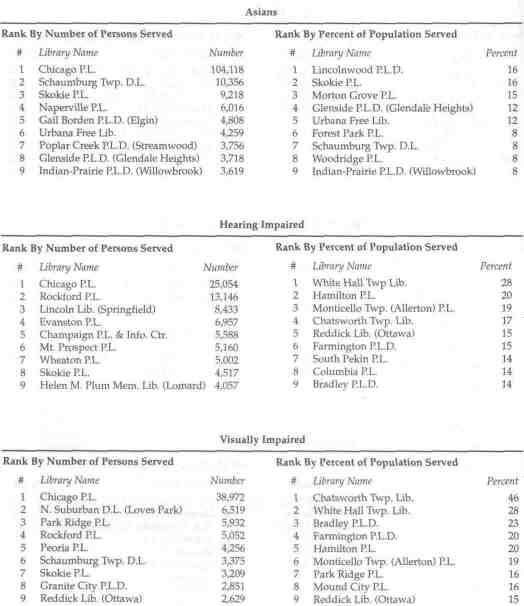
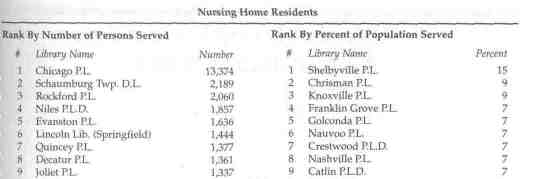
Special Populations Served by Illinois Public Libraries as Reported on the FY96 Per Capita and Equalization Aid Grant Applications Lisa A. Wright Each year the Illinois General Assembly appropriates money to the Office of the Secretary of State to fund various grant programs to support and improve library service in Illinois. Eligible public libraries apply for grants under the public library Per Capita Grant Program and the Equalization Aid Grant program. Grants of up to $1.25 per person served by the library are given to approximately 580 public libraries per year who meet the application and eligibility requirements. A public library, whose tax levy of at least .13 percent produces less than $4.25 per capita may be eligible for an equalization aid grant. In FY96, for the first time, the Per Capita and Equalization Aid Grants application requested public libraries, using community resources and statistics, report the number of persons in special populations served by their library. The following tables summarize the populations reported for the 597 public libraries that completed a Per Capita and Equalization Aid Grants application. The tables also rank the top 10 public libraries according to the number of persons served in each special population and the percentage each special population comprises of the total service population. Special Populations Served By Illinois Public Libraries The largest special population served by all Illinois public libraries is African-Americans (16.1 percent); followed by persons over the age of 16 who have an eighth grade education or less (14.1 percent), persons aged 65 or older (12.7 percent) and Hispanics (8.7 percent). The smallest special populations served by all Illinois public libraries are persons who are visually impaired (1.8 percent), persons residing in a nursing home (0.9 percent), and American-Indian persons (0.2 percent). Because the Chicago Public Library servers the largest population (27.0 percent) of all Illinois public libraries, the chart indicates each special population divided into the proportion of the statewide service population served by the Chicago Public Library and "All Other Illinois Public Libraries." The Chicago Public Library accounted for at least one-half of the statewide proportion of the following special populations: African-Americans (10.5 percent), persons over age 16 who have an eighth grade education or less (9.8 percent) and Hispanics (5.3 percent). Without the Chicago Public Library, the largest special population served in Illinois is persons aged 65 or older (9.5 percent), followed by African-Americans (5.6 percent), persons over the age of 16 who have less than eighth grade education (4.3 percent), persons who are physically impaired (3.6 percent) and Hispanics (3.4 percent). 150
151
152
153
154
*Lisa A. Wright, Project Coordinator, Library Research Center, Graduate School of Library and Information Science, University of Illinois at Urbana-Champaign 155 |Home|
|Search|
|Back to Periodicals Available|
|Table of Contents|
|Back to Illinois Libraires 1996|
|