 |
Home | Search | Browse | About IPO | Staff | Links |
|
Home | Search | Browse | About IPO | Staff | Links |
|
By THOMAS J. ANTON Turning back the clock: the new federalism in Illinois, Part II
PRESIDENT Reagan has taken advantage of the opportunity provided him by his first budget to develop his conception of a "New Federalism" in greater detail. Although his preferences for more defense and less social service spending were apparent in changes made to President Carter's 1981 and 1982 budgets, the implications of his hostility toward the "confused mess" in Washington were less obvious. The bold proposals laid out in the 1983 budget now make those implications perfectly clear. "Swap" and "turnback" are new buzzwords that, together with "cut" from last year, form a conceptual trilogy that defines Mr. Reagan's radical new plan. For 1983, Mr. Reagan proposes further large reductions in social programs targeted on the poor, further large increases in defense spending, and the consolidation of an additional 41 programs into seven new block grants, to be funded at reduced levels. Then, in 1984, Mr. Reagan suggests that states assume full responsibility for Aid to Families with Dependent Children (AFDC), now partially supported by federal grants, and for Food Stamps, now wholly supported by the federal government except for state sharing of some administrative costs. In return, the federal
This is clearly the boldest and broadest proposal for reform of American federalism to have been offered by a president in the past half century. Were it enacted, federal assistance to state and local governments in 1990 would constitute a smaller share of GNP than it did in 1950. Perhaps because of its boldness — and at this point its lack of precision — the plan stands little chance of enactment. Nonetheless it is important that we understand the plan, partly because the president seems strongly committed to it and partly because those proposals would have significant and therefore newsworthy consequences for all states. For Illinois and its midwestern neighbors, the news will be mostly bad. Policies that provide large increments for defense while imposing severe reductions on social programs can offer little comfort to the Midwest, while large new reductions in agricultural and energy programs will take even more federal revenue away from Illinois. Reductions across a broader range of federal programs will shrink the pot of money likely to be available in 1984 to fund the turnback programs. And the swap of Medicaid for welfare could well cost Illinois additional millions of dollars, depending on which of several sets of numbers and assumptions are used for calculation. As Mr. Reagan's program takes on a more definite shape, it becomes more and more harmful to the people and governments of Illinois. The budgetary context In my first article I pointed out that the Illinois share of federal budget outlays remained fairly stable during the 1970s, around an average of 4.33 percent of total spending. Outlays in IIlinois 26 | June 1982 | Illinois Issues increased from $9 billion to $27 billion during this same period, however, and the composition of those outlays changed quite noticeably. Periods of high unemployment and social distress in 1974-75 and again in 1979-80 led to increases in federal outlays for welfare programs such as AFDC, Supplemental Security Income (SSI) and Food Stamps, enlarging the significance of these "soft" dollar flows while decreasing the significance of "hard" dollars for programs such as highway construction and defense. By the end of the decade Illinois clearly had become a "soft-dollar" state: Defense spending accounted for only 10 percent of all federal outlays and "hard" federal dollars overall accounted for no more than 16 percent of total outlays. It is precisely this increased dependence on soft federal dollars that causes Illinois to suffer from President Reagan's budget policies. Large national increases in defense expenditures do not help Illinois very much, but large reductions in social service programs attack the most important sources of federal support for both citizens and governments in the state. Unfortunately for Illinois, these policies are not only continued, they are exaggerated in the 1983 budget. Total budget resources actually utilized in 1981 are compared with resources proposed for 1983 in table 1. As before, I include the value of federal government loans and loan guarantees, along with budget authority, in the concept of "budget resources." Doing so provides a more realistic estimate of fiscal impact than can be captured by the more restrictive concept of "outlays." All the figures are taken directly from the Appendix to the Budget of the U.S. Government, including recisions and supplemental contained in that document, and are summarized here in the 17 budget functions defined by the Office of Management and Budget (OMB). It is immediately apparent from these figures that the federal budget continues to exhibit substantial growth. Outlays are projected to grow by only 4.5 percent in the President's Budget Message, but when loans and loan guarantees are included as they are in table 1, total budget resources increase by nearly 17 percent from 1981 to 1983. Resource increments are
highly selective, however, in keeping with the president's clear priorities. Virtually all of the growth occurs in National Defense ($79 billion), Interest on the National Debt ($38 billion), Veterans Benefits ($11.6 billion) and Commerce and Housing Credit ($11 billion). The remaining functions either suffer large losses in funding (Energy, Agriculture, Education, Training and Social Services) or gain so little that they actually decline in budgetary significance (Income Security). The result is a noticeable but very selective shift in budget shares. Defense resources increase from 24.9 to nearly 28 percent of the budget in 1983, interest payments jump from 12 to 14 percent, and benefits for veterans
June 1982 | Illinois Issues | 27 approach 5 percent of the 1983 budget. On the other side, Income Security declines from 29 to 25 percent of the budget despite a $5.5 billion increment; Education, Training and Social Services drops to less than 3 percent; and even Agriculture suffers a noticeable funding loss. The president's cuts are obviously selective, but they appear to have become broader. Last year most of his cuts were made from social service programs; this year he takes large chunks from functions such as Energy and Agriculture as well. What remains firm and constant is his determination to provide large and rapid increases for Defense. The consequences for Illinois can be seen in table 2, which estimates per capita funding changes by function from 1981 to 1983 for Illinois and other states. For purposes of these calculations I have removed interest payments, which are known to be inaccurately reported and thus misleading in the calculation of state-by-state estimates. With interest excluded, total budget resources increase by some 14.3 percent between 1981 and 1983. Resources allocated to Illinois by the 1983 budget, however, are estimated to increase by only 6.7 percent from 1981 levels, less than half the national rate of increase and less than one-third the increment anticipated in California. Given current rates of inflation, this is likely to produce a loss in real purchasing power. Further reductions in social service programs such as AFDC or CETA (Comprehensive Employment Training Administration) are now joined by sizable per capita reductions in agricultural credit and highway construction programs. Like other states Illinois gains from the large social security and other retirement expenditures listed here under the "other" category, but once again Illinois suffers from defense anemia. Only Wisconsin, with a per capita increase of $94, gains less from the 1983 defense budget than Illinois, whose $106 increment is a mere one-sixth of the $627 per capita increment estimated for California. Over all, residents of Illinois will gain $311 per
Illinois' inability to participate more generously in present patterns of budgetary growth has serious structural consequences. For one thing, Illinois is falling further behind other states in per capita federal spending. The slight $311 increase between 1981 and 1983 in per capita resources allocated to Illinois brings total per capita resources (less interest) up to $2,541, which is more than $1,000 less than the 1983 national average, $2,000 less than per capita spending proposed for California, or Washington, or Missouri, and more than $3,000 less than per capita resources made available to Virginia or Hawaii. It is hardly surprising, therefore to learn that the Illinois share of total national budget resources — stable during the 1970s — is now in decline. Were President Reagan's 1983 budget enacted, Illinois would receive no more than 3.8 percent of those resources, as compared to the 4.3 percent average annual share during the 1970s. Ironically enough, decline in the Illinois share of total national budget resources has occurred at a time when the state's need for those resources — as measured by such indicators as percent unemployed or percent on welfare — has been increasing. Turning away from need is indeed a "new" federal policy, but residents of Illinois might well wonder what they had done to deserve it. In addition to larger defense increments and broader budget reductions, the 1983 budget carries further the process of consolidating separate programs into block grants. Seven new block grants consolidating 41 separate programs are proposed (see table 3), involving some $6.5 billion in 1983 spending. Three of the block grants enacted last year are amended as well, the most significant being the expansion of the Maternal and Child Health block to incorporate the Women, Infants and Children nutritional assistance program. Were this portion of the president's program enacted he would have achieved consolidation of some 103 programs into just 16 block grants within his first two years in office, reducing federal spending for these programs by some 30 percent or more in the process (see table 3). These would be genuinely striking accomplishments. The 103 programs represent nearly 20 percent of the roughly 600 financial assistance programs listed in the Catalog of Federal Domestic Assistance, while the $14 billion in grant reductions not only reverses a 20-year 28 | June 1982 | Illinois Issues
trend of large annual grant increments, but it brings grants as a proportion of GNP back to levels not experienced since the 1960s. For Illinois, of course, these changes would be striking in a different sense entirely. Since many of the reduced and consolidated programs fall into the social service area, Illinois could be expected to bear a disproportionate share of those reductions as well. County winners and losers If the Illinois share of national reductions will be disproportionate, so too will the distribution of these reductions within the state. The size and socioeconomic variety that are Illinois' great strengths imply similar variation in the extent to which different counties participate in federal assistance programs. Depending on which programs distribute dollars into which counties, therefore, the experience of loss or gain within the county jurisdiction can range from very small to very large. Because most federal dollars are distributed according to decision rules that take population into account, federal spending in Illinois is highly concentrated in the counties with the largest populations. During the 1970s the 10 counties with the largest average annual share of total federal outlays accounted for more than three-quarters of all federal spending within the state. These counties, ranked by the outlay share in table 4, include the heavily populated northeastern counties of Cook, Lake, DuPage, Kane and Will, as well as five downstate counties with large urban centers: the counties of Sangamon, St. Clair, Champaign, Peoria and Rock Island. With the exception of Winnebago (Rockford) and Macon (Decatur) these counties include all of the largest cities in the state. Cook County dominates the list, of course, with an annual average during the 1970s of nearly 52 percent of federal spending in Illinois, somewhat more than the county's population share of 48 percent. Although not shown in table 4, the Cook County annual share increased dramatically after 1972, largely because of large increments in Medicaid payments that continued through the end of the decade. County shares of total federal spending otherwise remained relatively stable through the 1970s, again reflecting the dominance of population in criteria for fund distributions. The components of each county's federal payments share are very different, however. Cook County, which has been receiving nearly 64 percent of all the Medicaid money coming into Illinois, receives only 0.145 percent of all Commodity Credit Corporation loans allocated to Illinois,
One way to see these different combinations is to compare receipts from major programs in different types of counties. Table 5 provides such comparisons in the form of estimates of per capita spending in 1983 for seven different counties, including the most urban (Cook), two of the most agricultural (McLean, Hancock) and two of the poorest (Pulaski, Gallatin). By using per capita program comparisons, we can develop a better sense of the significance of these programs to the county than is available from simple dollar totals. And by reporting the percentage change from 1981 levels, it is possible to see the magnitude and direction of change proposed in the Reagan budget. For those who have not closely monitored the development of these programs during the past decade or so, it may be useful to point out the very different orders of magnitude they involve. Consider the welfare programs on a statewide per capita basis: AFDC payments are only 8 percent of estimated military spending and barely 4 percent of social security spending; estimates for Medicaid are less than 19 percent of Medicare, 7 percent of social security and 14 percent of military June 1982 | Illinois Issues | 29 expenditures. Food Stamps — the now famous "orange and vodka" program — are 11 percent of military outlays in the state and less than 6 percent of social security estimates, per capita. Welfare programs are large and sometimes problematic, but their fiscal significance is
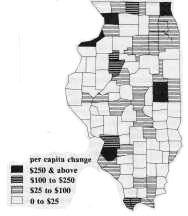
Note furthermore that per capita program differences between counties are enormous, and that Cook County seldom leads the way in per capita allocations. Projected military spending in Cook for 1983 is not even one-tenth of estimated expenditures in Rock Island and hardly one-eighth of expected military spending in neighboring Lake County, site of the Great Lakes Naval Training Station. Cook is second to Pulaski County in estimated per capita spending for AFDC, Medicaid and Food Stamps, and stands third — behind Pulaski and Rock Island — in both Social Security and Medicare. Cook County does not lead in any of these programs and its $20 per capita in highway spending is $12 less than the statewide average for this program, making clear that projected 1983 federal highway spending will take place largely outside these counties. Although the state's largest and most urban county continues to receive far more federal money than other counties, on a per capita basis, it is seldom first and often far behind other counties in spending for particular programs. Illinois, in short, is an enormously varied state. Flows of federal funds reflect that regional variety. Within this variety, however, three patterns seem clearly discernible. In the urban counties, substantial dollar losses will be experienced in social programs such as Medicaid or AFDC, and because of erratically available funding for capital projects such as highway construction, Cook, Peoria and St. Clair counties will suffer additional funding losses. At the same time, however, these counties will gain most of the defense spending increase expected in Illinois. While not large from a national point of view, 90 percent or more of this increment will flow into just 10 of the most urbanized counties in the state. These dollar increments, furthermore, will be considerably larger than the dollar losses expected in welfare programs. Urban counties, therefore, can be expected to experience a net gain in total federal dollars (see map 1). Paradoxically enough, this will not mean that governments or people in urban counties will be any better off. Because
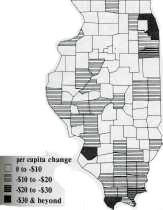
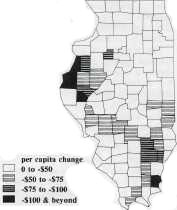
low-income population groups are also concentrated in urban areas many people will experience losses in AFDC, CETA jobs or training grants, Food Stamps or access to hospitals, and many governments will experience losses in funds to support these pro-grams (see map 2). The gains in federal dollars will be distributed primarily to defense suppliers and contractors, employees of military bases and businesses supported by these groups. In other words, the gain in federal dollars will be accomplished by a shift in beneficiaries, away from individuals and governments assisted by social program grants, toward military employees and defense industry producers. If this is not precisely taking from the poor to give to the rich, it is at least taking from the poor to give to the richer. In the prosperous agricultural counties, on the other hand, participation in existing federal programs is slight. Thus even major federal changes of the kind proposed by President Reagan are unlikely to cause major disruption in these areas. As the figures for McLean County suggest, these areas will gain little from increases in defense spending, but neither will they lose many dollars from cuts in social programs.. In any case, Social Security and Medicare payment levels are sufficiently high in such counties to help cushion the losses in social assistance programs. For most of the prosperous agricultural areas of central and north central Illinois, therefore, gains and losses from 1983 budget policies are not likely to produce significant impacts. Quite the reverse is probable for a number of marginal rural counties, such as Gallatin and Pulaski in the southern portion of the state, or Hancock on the western border. In general these counties will gain little from defense increases — although Pulaski is something of an exception — but will be hurt a great deal by reductions in programs such as Medicaid or Food Stamps which are far more important to these counties than elsewhere. They will also be seriously affected by the major reductions contemplated for Farmers Home Administration (FmHA) programs such as farm operating or ownership loans (see map 3). Social Security and Medicare benefits are substantially higher in such counties 30 | June 1982 | Illinois Issues
than elsewhere, but the "cushion" provided by these programs is obviously eroded by large reductions in welfare programs. These are the coun-I ties, in broad areas of southern and western Illinois (maps 2 and 3), that can be expected to bear the brunt of 1983 budgetary reductions. The old, the poor and the marginal of these areas will join with the dependent populations of Illinois cities in shouldering the burden of the 1983 Reagan budget. In the long run, of course, the weight of that burden will depend to some extent on the ability of federal tax reductions to stimulate economic recovery. Illinois citizens have achieved some benefit already from the president's tax reduction, and they will shortly find even more money in their pay checks. Unfortunately, high and increasing levels of unemployment dilute the potential benefits of these tax reductions while increasing the drain on tax-supported programs for social assistance. Similarly, Illinois corporations should benefit from more liberal depreciation and tax allowances, but only if and when economic conditions permit such benefits to be sought. At this writing (early April) extraordinarily high interest rates continue to suppress both the higher corporate earnings that would generate higher tax savings and the increased investment that was intended to be a product of more rapid depreciation allowances. Nor is there yet any real sign that the current economic recession has ended. In the short run, therefore, the pain caused by losses in federal dollars is unlikely to be alleviated significantly by an improved economy. Illinois citizens will have to tough it out themselves. The swap and turnback The swap and turnback proposals are more dramatic, more interesting and more difficult to interpret than other portions of the president's program. Part of the difficulty arises from the sensitivity of these ideas to different assumptions about future program needs and relationships: presidential staff assert that the state Medi-caid costs to be assumed by the federal government in 1984 will be roughly $2 billion higher than the federal payments for AFDC and Food Stamps that will be assumed by the states; thus states will experience a net gain in the swap. The Congressional Budget Office (CBO), on the other hand, believes that the federal AFDC and Food Stamps contributions to be assumed by the states will be some $2 billion higher than the state shares of Medicaid that are to be assumed by the federal government; under this assumption states are losers in 1984, and their losses increase through 1987. My own analysis, based on the figures in the August 1981 Reconciliation Bill, indicates a $2 billion loss spread among 43 of the 50 states if the swap had taken place in 1982. If projected to 1984, this pessimistic guess implies that Illinois could lose millions of dollars that presumably would have to come out of the new trust fund if Illinois were to be held harmless. Another source of confusion is OMB's official ambiguity regarding the precise programs proposed for turnback to the states. Official budget documents contain only an "illustrative" list, and OMB has been reluctant to be more specific on grounds that the matter is under negotiation with the nation's governors. Illustrative or final, proposed expenditures for these programs in 1983 are nearly $13 billion less than 1981 expenditures, according to our calculations (see table 6). Illinois' losses come to nearly $596 million between 1981 and 1983. Since there is considerable overlap between these programs and new block grants whose reductions already have been estimated, only a fraction of these turnback losses are additions to
The significance of these figures is not so much the total amount involved as the relationship between these totals and the proposed trust fund. Recall that the trust fund is intended to cover the costs of the turnback programs during 1984-87, with each state's allocation based on a three year (1979-81) average of that state's receipts from each program. The $28 billion fund proposed, however, is not only $16 billion short of what was spent on these programs in 1981 but $3.2 billion short of what the president proposes to spend in 1983 — unless, of course, the administration is right in guessing that the states will have an additional $2 billion available from the swap, in which case the shortage is reduced to just over $1 billion. If the CBO or my own estimate is better, the proposed trust fund could be short by $5 to $6 billion or more in 1984 alone. States clearly would be well-advised to anticipate a drive for further large reductions in federal assistance in the fiscal 1984 budget. Whether or not such a trust fund could be brought into some kind of balance with anticipated expenditures on the turnback programs would, of course, depend to a considerable extent on whether it works. At this writing the outlook is hardly optimistic. It is obvious enough that federal excise taxes on alcohol, tobacco, telephone service and gasoline can be used to generate roughly $11 billion and that another $16 billion or so could be extracted from windfall profits taxes on oil. It is far less clear that states will be willing June 1982 | Illinois Issues | 31 to accept these arrangements. If the experience of the 1950s is any guide, achieving state agreement will be extraordinarily difficult. The problem, of course, is that individual states pay very different shares of these taxes. If the taxes are to be earmarked for support of designated programs prior to ultimate transfer back to the states, high-payment states may well oppose any plan that returns less to them from the trust fund than they put into it. This is not a major problem for Illinois, which pays some 5.02 percent of these excise taxes and which will receive
It could be argued, on the other hand, that states contributing more than they receive in the 1984-1987 period will be winners in the long run, since, beginning in 1988, these tax sources will be gradually returned to the states. If they choose, states can levy the same taxes and enjoy new revenues at no increased costs to their taxpayers. One major problem with this profitably benign scenario is that it would work in only a few states. Four states pay 53 percent of the federal excise tax on gas, six states pay 51 percent of the alcohol tax, seven states pay 55 percent of the telephone excise, and adding Virginia and Kentucky to North Carolina incorporates nearly 95 percent of the tobacco tax. For each of the tax sources to be returned, therefore, only a few states would gain very much; most would lose far more in federal funds than they would gain in new tax revenue. Illinois, for example, paid $559 million in these excise taxes in 1980; actual federal spending in Illinois in 1981 for the programs proposed for the turnback was $2,165 billion. Even allowing for a reduction in 1983 federal spending for the turnback programs to $1,569 billion, these resources would be wholly insufficient unless major program reductions were made. An early winner, Illinois would become a late loser. The other major problem with the benign scenario is that it overlooks the largest source of trust fund revenue, which is not these excise taxes but the windfall profits tax. Most of this tax is now paid by only a handful of states, who will have to be persuaded that it is in their interest to contribute disproportionately to the trust fund from 1984 to 1987 in order to gain large new state tax resources after 1988. Persuasion will not be easy since, as presently written, the windfall profits tax is itself scheduled to phase out sometime after 1987, when the "excess" profits have been nationalized. It is thus unlikely that even these few states can look forward to this new source of state tax revenue after 1988. For them, as for the other states, the turnback programs that remain will have to be funded from existing state revenues, or
It should now be apparent that the "swap" and "turnback" portions of the president's "new federalism" are hardly more than ambiguous first cuts at an exceedingly complex set of problems. The precise programs to be turned back to the states remain unspecified; the adequacy of the proposed trust fund to support those programs during 1984-1987 depends on unverifiable assumptions regarding the swap of Medicaid for welfare; the implications of allocating the trust fund by program shares but financing it through tax shares have not been thought out; nor has there been much consideration given to the dynamic processes through which early winners become late losers and early losers become late winners. Enveloping these ambiguities is only one clear goal, which is simultaneously the one clear consequence of the president's proposals: further reductions in state and I local government spending. All else seems secondary. Reagan's new federalism is a "program" in only a loose sense. Although the swap and turnback ideas are generally consistent with the president's 1982 and 1983 budget policies, they appear to have been tacked onto the 1983 budget as an afterthought, with little attention to the details of some very complicated proposals. With uncertainty surrounding the 1983 budget as a whole, it is not clear that many of these loosely fashioned proposals will be given much attention. Huge projected deficits, interest rates that remain prohibitively high and the highest level of unemployment in decades clearly are problems that command more attention than occasionally esoteric discussions of turnbacks and phase-outs. Federalism is nevertheless a real issue, as evidenced by the continuing interest shown the president's proposals by the nation's governors. The president himself, moreover, seems committed to keeping his plan on the agenda. If so, Illinois would do well to pay attention. On the whole those portions of the new federalism that can be clearly understood are bad for Illinois. The massive shift to defense spending hurts because funds for that shift are being taken from social, agricultural and environmental programs that benefit Illinois far more than does the defense industry. The program consolidations, desirable on administrative grounds, hurt because they are accompanied by 30 percent cuts in consolidated programs. The turnback proposal would 32 | June 1982 | Illinois Issues hurt because it would reduce federal outlays in Illinois by some $600 million below 1981 levels for the affected programs. Although less clear, it is certainly possible that the swap would also hurt by providing less federal support than the state would be required to spend to maintain AFDC and Food Stamps expenditures. Only the tax changes appear to help, but economic conditions have so far blunted the potentially powerful impact of reduced tax collections. These "hurts" are of course selective, in keeping with the president's clear preferences. Defense contractors, corporations and prosperous farmers in Illinois should be helped rather than hurt by Mr. Reagan's program. The poor — particularly the elderly poor — the unemployed, social service professionals and many governmental agencies will be among the most hurt. Whether or not these kinds of beneficiary shifts are desirable is perhaps the most important issue raised by the president's program. How that issue is resolved will do more to shape the future of federalism of the United States of America than any structural reform yet proposed. Thomas J. Anton is professor of political science at the Center for Political Studies, Institute for Social Research at the University of Michigan, Ann Arbor. His most recent book is Moving Money (1981); earlier works include The Politics of State Expenditures in Illinois (1966). The author notes that after this article was written, the New York Times reported on April 7, 1982, that the administration had abandoned its plan to submit legislation implementing the swap proposal this year. According to the story, administration officials had reached an impasse with the National Governors' Association over the proposal. In addition to the generous grant from the Ancel Charitable Trust, which made it possible to complete these two articles on new federalism for Illinois Issues, the author wishes to acknowledge a grant from the National Science Foundation (DAR-7924155) which made it possible to collect and process the data, and the assistance of John Oppenheim and Kathryn Jones. Anton adds, "None of these individuals and organizations, however, should be held responsible for the conclusions offered, which are solely my own. " June 1982 | Illinois Issues | 33 |
|||||||||||||||||||||||||||||||||||||||||||||||||||||||||||||||||||||||||||||||||||||||||||||||||||||||||||||||||||||||||||||||||||||||||||||||||||||||||||||||||||||||||||||||||||||||||||||||||||||||||||||||||||||||||||||||||||||||||||||||||||||||||||||||||||||||||||||||||||||||||||||||||||||||||||||||||||||||||||||||||||||||||||||||||||||||||||||||||||||||||||||||||||||||||||||||||||||||||||||||||||||||||||||||||||||||||||||||||||||||||||||||||||||||||||||||||||||||||||||||||||||||||||||||||||||||||||||||||||||||||||||||||||||||||||||||||||||||||||||||||||||||||||||||||||||||||||||||||||||||||||||||||||||||||||||||||||||||||||||||||||||||||||||||||||||||||||||||||||||||||||||||||||||||||||||||||||||||||||||||||||||||||||||||||||||||||||||||||||||||||||||||||||||||||||||||||||||||||||||||||||||||||||||||||||||||||||
|
|