 |
Home | Search | Browse | About IPO | Staff | Links |
|
Home | Search | Browse | About IPO | Staff | Links |
|
By THOMAS J. LEE 1991 redistricting: Will suburbs get their share? Next year's census will quantify what people can already see for themselves. More and more, the verdant cornfields on the fringe of metropolitan Chicago have given way to less-than-verdant suburban subdivisions. And as the 1991 redistricting will demonstrate, these new subdivisions and the continuing growth of suburbia lie at the heart of the struggle for the state's political apparatus. The extent to which the 1991 redistricting adequately accounts for this continuing migration to suburbia is of critical importance to political power brokers of both parties, to politicians with ambition for statewide office and to the fate of everyone's political agenda. Illinois expects to lose one or two congressional seats, and redistricting will determine whose seat or seats are lost. The 1991 redistricting bears heavily on which party will wield the gavel in both chambers of Illinois General Assembly. In the suburbs, Republicans outnumber Democrats by ratios of 2 to 1 or more. The GOP hegemony is especially strong in new subdivisions and the fastest growing suburbs. Chicago-based Democrats look with foreboding on suburbia's growth; unless they can compete more effectively for these voters or otherwise challenge the Republican dominance there, Democrats face a long-term erosion of their political might. The extent to which Democrats seriously compete for suburban votes is debatable. U.S. Sen. Alan J. Dixon and stale Comptroller Roland W. Burris, both downstate Democrats, consistently do quite well in suburban precincts, but Democratic presidential nominees usually fare miserably, and suburban Democratic organizations typically pale against their GOP counterparts. This checkered performance has left Democrats with decennial redistricting as a powerful strategic complement to year-in, year-out political combat. Republicans emerged fairly unscathed from the 1971 redistricting only to suffer the whiplash of Watergate three years later. In 1981, blessed by the luck of the draw but shrewdly anticipating judicial review, Michael J. Madigan, leader of the then-minority House Democrats, used redistricting to take control of the Illinois House. Since then Democrats have controlled both House and Senate. Six factors, beyond the institutional redistricting framework of procedure and partisanship, will together determine how the suburbs fare. These dynamics were at work in 1981, but they have evolved since then. They include not only the self-evident factor of census data but also a recent Census Bureau agreement on measuring the so-called urban undercount; the Democratic-inspired mapmaking precedents set here in 1981; three key judicial decisions since 1981; technological advancements
August & September 1989 | Illinois Issues | 20 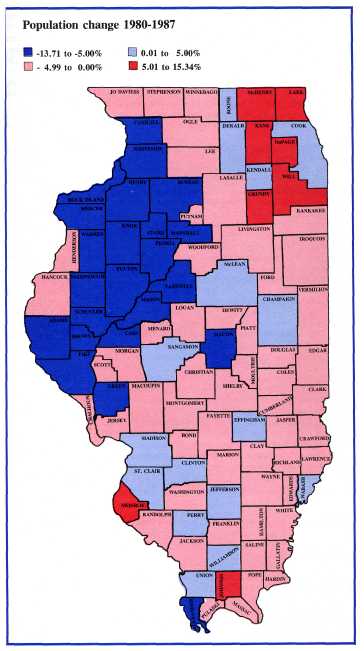 enabling legislative leaders to produce and assess maps by desktop computer; and the racial schism in Chicago and the prospect that minorities and suburban Republicans will again join in an "unholy alliance." (For analysis of the institutional framework involving partisanship and process in 1981, see "Redistricting '81," by Charles N. Wheeler III, April 1981 Illinois Issues.) The numbers from the census are nominally paramount, as always. Historically Illinois has had uneven growth. By the beginning of the 20th century Chicago's phenomenal development had so threatened the power of rural interests that downstate leaders blocked any legislative redistricting until 1955. It's no longer possible to stave off redistricting, and the uneven growth that enabled Chicago to assert itself in the General Assembly beginning in the mid-1950s now bodes well for the suburbs. If predictions by the Illinois Bureau of the Budget hold out, the 1990 census will put the state's population at just over 11.7 million, an increase of about 285,000 people, or 2.5 percent, since 1980. The growth within Illinois is wildly fluctuating from one area to another (see accompanying map and table). Most down-state counties are losing population, while Chicago and its suburbs in Cook County and the five collar counties are accounting for virtually all of the state's growth since 1980. But the growth is uneven within the six-county Chicago metropolitan area. Predictions by the Northeastern Illinois Planning Commission (NIPC) suggest that Chicago will register a 1 percent gain in population while suburban Cook County records an increase of 3 percent. NIPC's calculations show that the five suburban metro collar counties, DuPage, Kane, Lake and McHenry, are growing at decennial rates well into the double digits, but again this growth is uneven. Will's has slowed, and within DuPage, for example, from 1980 to 1986, Naperville (the fastest growing muncipality in Illinois) grew from 42,601 to 67,371 while the older community of Bensenville dropped slightly, from 16,106 to 15,950. NIPC believes the overall growth of the suburbs is so substantial that its voters will finally overtake their downstate brethren as the state's most populous geographic voting bloc: up from 32 percent of Illinois total population in 1970 to 36 percent in 1980 and almost 38 percent in 1990. Chicago, having slipped from 30 percent of the state's population in 1970 to 26 percent in 1980, will decline a tad. Downstate, the vast geographic area outside the metropolitan Chicago area, will decline slightly, to 36 percent of Illinois population by 1990. If these predictions hold true, the 1990 census will show that Chicago's population has bottomed out at just over 3 million. These projections, however, were compiled before the Census Bureau reached an agreement on July 17 with civic groups and governments across the country that brought suit alleging an undercount. As a result Chicago's population may ultimately include a positive adjustment. Under the agreement, three months after the regular April census, the Census Bureau will conduct a selectively random survey of 150,000 homes nationwide to determine the extent to which it missed people. The bureau will then compare the July survey with its April census to determine how many people it missed. The Census Bureau has not committed itself to using the data to correct an undercount, but it has agreed to keep "an open mind" on the question. Big cities across the United States are hoping for the best. Chicago has asserted the 1980 census missed 4 percent of its population, or 132,000 people. Adjusting the 1990 count by such a figure would clearly have a material effect on the city's representation in the state legislature, if not Congress. Another dimension to the 1991 redistricting is the precedent, established in 1981, of extending legislative and congressional districts across the borders of governmental subdivisions, in particular, the old "Chinese Wall" that separated Chicago from its suburbs. Prior to 1981 the city had its own districts and the suburbs had theirs; few districts ventured very far into the other's territory. As a result of the 1981 redistricting, seven of the eight congressional districts held by Chicagoans reach into the suburbs. One is so lithe it stretches from the singles bars along Division Street to the corporate suites along the Tri-State Toll way, and another extends from the Loop to suburbs west of Mannheim Road. The map forced Republicans to pay with both congressional seats lost by Illinois to other states. August & September 1989 | Illinois Issues | 21 The story is the same for Illinois General Assembly districts, though of course the total number of seats won't change. To the lasting dismay of GOP leaders, Madigan's cartography extended Chicago's legislative districts deep into neighboring suburbs and even beyond the city's periphery to make it possible for Democrats like Grace Mary Stern of Highland Park to win election in marginally Republican districts. Hers straddles Lake and Cook counties. Case law developed since 1981 is another dimension to redistricting as it bears upon the suburbs. Three decisions stand out: a 1983 ruling that imposed tighter limits on population variation among congressional districts; a 1986 decision that appears to have set the stage for challenging egregiously partisan gerrymandering; and a 1989 case in which the high court nevertheless dismissed a GOP suit against California's arguably gerrymandered congressional districts. Before the 1983 decision, Karcher v. Dagget, the courts had long scrutinized variation in population among districts. Congressional districts whose population was within 1 percent of one another generally passed muster on grounds of population, and the courts looked to other criteria such as compactness and contiguity or infringement on minority voting rights. But in Karcher, the Supreme Court invalidated a New Jersey congresional map whose districts varied by only .69 percent. (Courts have granted more leeway to state legislative maps.) The 1986 case, Davis v. Bandemer, may have greater repercussions. The court determined that partisan gerrymandering can be declared unconstitutional to the extent it locks one party into control, but it stopped short of specifying the criteria by which it would measure such gerrymandering. The majority opinion included a footnote offering encouragement to victims of redistricting: "Projected election results based on district boundaries and past voting patterns may certainly support this type of claim, even where no election has yet been held under the challenged redistricting" (italics original). But in a 1989 case, Badham v. Eu, the court turned back a challenge to California's congressional map, although partisans generally agree it is extensively gerrymandered. Kimball W. Brace, president of Washington-based Election Data Services, warns that maps will have to minimize the district-by-district variation in population in order to survive judicial review. "You have to lay the groundwork for a court case," Brace says. That's where the technology comes in. In 1981, strategists for both parties rented room-sized computers and labored through the night to draft maps. In 1991, desk-top and perhaps even lap-top computers will do the same job. The computer tapes from the Census Bureau will be available about a year after its census, detailing just how many people live where. That data, coupled with precinct-by-precinct partisan voting records from 1988 and 1990, will serve as the foundation for the legislative and congressional redistrictings done by the General Assembly in 1991. The final dimension to the impact of 1991 redistricting on the burgeoning suburbs is the extent to which suburban Republicans will join with minorities to block any efforts by white Democrats to overlook minority representation. Ten years ago Chicago's racial schism was a political undercurrent. Then Harold Washington was elected mayor in 1983. The hostility is again beneath the surface, as Chicago Mayor Richard M. Daley strives to accommodate the interests of all Chicago Democrats — black and Hispanic and white. The 1991 redistricting will take place just a few months after Daley presumably campaigns for reelection — quite possibly against a black challenger. Moreover, redistricting of Chicago's wards will occur more or less at the same time. Republicans nationwide hold out the hope of coalescing with blacks and Hispanics to assert their mutual interest in political survival. There is such a precedent in Illinois, where Republicans and black civic groups joined in both legislation and litigation over 198l's redistricting. With almost two years to go, the 1991 redistricting dynamics are still not firmly in focus. It is apparent, however, that factors beyond raw census data and luck will have a profound effect. □ Thomas J. Lee is a former suburban Chicago journalist who is presently working on a master's degree at the University of Chicago Graduate School of Public Policy Studies. August & September 1989 | Illinois Issues | 22
| |||||||||||||||||||||||||||||||||||||||||||||||||||||||||||||||||||||||||||||||||||||||||||||||||||||||||||||||||||||||||||||||||||||||||||||||||||||||||||||||||||||||||||||||||||||||||||||||||||||||||||||