By PAUL M. GREEN
Vote analysis
Illinois for Clinton and Braun,
comparing regional strengths and past trends
In 1964 gas was 30 cents
a gallon, boxer Mohammed Ali still called
himself Cassius Clay, and
Chicago's newest skyscraper
was the Marina City housing
complex. It would be the last
time for 28 years that a Democratic presidential nominee
(Lyndon B. Johnson) would
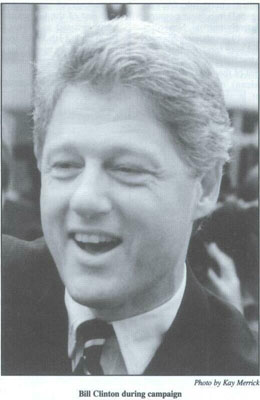
carry Illinois. Bill Clinton's
smashing 1992 victory over
Republican George Bush and
independent Ross Perot
ended the string of GOP Illinois presidential wins.
Clinton's statewide victory
margin over Bush exceeded
both Ronald Reagan's strong
Illinois wins in 1980 and
1984. In the U.S. Senate race
Democratic Carol Moseley
Braun easily whipped Republican Rich Williamson, making her the country's first
African-American female
U.S. senator.
What is not mentioned
often in this state is that in
1992 Illinois Republicans lost
their fifth consecutive U.S.
Senate race, thereby matching
the Democrats' futility level in
the last five Illinois gubernatorial elections.
|
The total Illinois vote is
coming more and more from Chicago's suburbs especially the five collar counties of DuPage, Kane, Lake, McHenry
and Will (see tables 1 and 2). In raw numbers each region of
the state increased its turnout in 1992 over their 1988
figures, but only the collars increased their overall percentage of the statewide vote.
Statewide, the turnout for
the 1992 election was 14 percent higher than in 1988: 4.5
million voters went to the
polls in 1988; 5.2 million
voted in 1992 (see tables 1
and 2). By far the largest percentage increase took place in
the collars, where nearly 26
percent more voters went to
the polls. In fact, the 1992
voter turnout increase in the
collars was greater than the
combined 1992 increase in
Chicago and suburban Cook
County.
The dramatic decline in
Chicago's vote power in statewide elections also continued
in 1992. In 1960 Chicago cast
35 percent of the total state
vote. In 1992 only 22 percent
of Illinois voters cast ballots in
the Windy City. Only the incredible rise of Democratic
vote strength in Chicago
keeps the city as a major
counterbalancing force to
suburban vote muscle. In
1960 John F. Kennedy,
backed by the full weight and
power of Mayor Richard J.
Daley's political machine,
won 63.6 percent of the city's
vote. In 1992, a far more culturally and politically diverse Chicago, led by Mayor Richard M. Daley, gave Bill Clinton 72 percent of its vote.
Clinton destroyed his opposition in Chicago, with a
victory margin of almost 600,000 votes. He carried 49 of 50
wards. Despite the fact that the presidential election was a
|
February 1993/Illinois Issues/25
three-way race, Clinton received nearly
60,000 more votes in Chicago than
1988 nominee Michael Dukakis, increasing the Democratic city vote total
by 2 percent (70 percent to 72 percent),
and most astonishingly upped the Democratic city victory margin over George
Bush by 175,000 votes.
As in 1988 the African-American
wards (especially those in middle-class
southside wards) led the Clinton bandwagon. In 10 wards (all south side) he
won by margins of over 20,000 votes.
In 15 other wards he received at least
10,000-vote victory margins. Four of
these latter wards are predominantly
white lakefront wards (44, 46, 48, 49) while another is the
still heavily Jewish 50th Ward on the far north side. Only on
the far southwest side (old Reagan Democratic country)
were Clinton victory margins relatively narrow. Nevertheless, in only six of Clinton's winning 49 wards were his vote
totals less than the combined ward vote totals of Bush and
Perot (wards 45, 38, 36, 13, 23, 19).
Clinton received over 90 percent of the vote in 15 wards
(all predominantly African-American), over 80 percent in
five wards and over 70 percent in six wards. His only
relatively narrow ward victories occurred on the northwest
side, where he defeated Bush by less than 10 percent in two
wards (45 and 38). Bush received fewer than 200,000 votes
in Chicago (see table 3). His citywide vote percentage was a
paltry 18 percent, and he was able to win only one ward
(41). Compared to 1988, Bush's Chicago totals dropped
over 115,000 votes, his vote percentage fell 12 percent,
while his ward victories dwindled from eight to one. In only
one ward (41) was he able to win over 40 percent of the
vote, while in 18 predominantly black wards he garnered
less than 10 percent of the vote.
|
Though the Perot factor's impact on the vote may be
unclear in other places in Illinois and in the nation, it
seems obvious that in Chicago Perot hurt Bush.
Perot was unable to win 20 percent of the vote in any ward.
The Texas billionaire ran best on the northwest and southwest sides. Along the lakefront he ran in the low double
digits, while in black and Hispanic
wards he was mainly in the low single
digits. Statewide, Chicago was by far
the least hospitable region for Perot.
Still, the unconventional independent
won over 100,000 votes in Chicago,
with most of them coming from areas
where in previous elections GOP presidential candidates Reagan and Bush
had made major dents in Democratic
totals. Without Perot in the race Bush
would not have won over all of these
voters, but he would have at least had a
chance to win many of them.
|
Though the Perot factor's
impact on the vote may
be unclear in other places in
Illinois and in the nation,
it seems obvious that in
Chicago Perot hurt Bush
|
A final note about Chicago's vote
turnout. The citywide turnout average
was 74.5 percent. Three of the five wards with the top
percentage of turnout were lakefront wards (44, 42, 43).
The rest of the top wards by turnout were located on the
northwest and southwest sides. (House Speaker Michael J.
Madigan's 13th Ward led all the rest with an 88.4 percent
turnout). Only two African-American wards (6 and 8) had
turnout percentages above the citywide average.
| Table 1 |
| Voter turnout in Illinois by region, 1992 v 1988 |
| |
1992 |
1988 |
Difference |
| |
Votes |
% of
state vote |
Vote |
% of
state vote |
Vote |
% of
state vote |
| Chicago |
1,137,379 |
22.0% |
1,055,285 |
23.3% |
+ 82,094 |
-1.3 % |
| Suburban Cook |
1,062,229 |
20.6 |
953,270 |
21.0 |
+108,959 |
- .04 |
| Collar counties |
982,329 |
19.0 |
781,282 |
17.3 |
+201,047 |
+1.7 |
| Downstate |
1,982,420 |
38.4 |
1,737,042 |
38.4 |
+245,378 |
|
| Illinois total |
5,164,357 |
100.0 |
4,526,879 |
100.0 |
+637,478 |
|
|
The raw ward turnout numbers tell a somewhat
different story about the potential political impact of
demographic shifts in the city and its recent ward
remap. Only three so-called ethnic wards made the top 10
in total votes cast. They were joined by three lakefront
wards, three African-American wards and the racially split
southwest side 18th ward. The mainly Hispanic wards filled
the list of the lowest turnout wards in the city.
Clinton carried the Cook
County suburbs. In 1988 these 30
suburban townships had given
George Bush a 169,000-vote
margin. In 1992 Bush lost them
by almost 51,000 votes. Clinton
won just 12 townships, but five of
them (Evanston, Niles, Oak Park,
Proviso and Thornton) gave him
victory margins of over 100,000
votes. All five townships except
Niles have significant black populations and a liberal voting past.
Niles, with a huge Jewish popula-
|
Table 2
1992 v. 1988 voter turnout
in Illinois, percentage
increases by region |
| |
%
increase |
vote
increase |
|
Chicago
|
+ 7.8%
|
+ 82,094
|
|
Suburban
Cook
|
+11.4%
|
+108,959
|
|
Collar
counties
|
+25.7%
|
+201,047
|
|
Downstate
|
+14.0%
|
+245,378
|
|
Total
|
14.0%
|
+637,478
|
|
26/February 1993/Illinois Issues
tion, also has supported liberal candidates in the past.
However, the most important link among the five townships
was a shared dislike of Bush and Dan Quayle.
Clinton's other winning townships were mainly in the
more integrated south suburban area, though he did also
carry upscale and sometimes liberal north suburban New
Trier township. Calumet and Evanston townships, with their
black communities voting, gave Clinton over 70 percent of
their vote. Bush did not come close to these percentages in
any of his township wins.
Bush won 18 townships, but in only Barrington Township did he win a majority of the vote. Bush was
unable to win any township by 10,000 votes. Northwest suburban Palatine Township gave Bush his largest
margin of victory (9,141 votes). Compared to 1988, his
township margin dropoffs are amazing. His most lopsided
victory in 1988 was in Wheeling Township with a margin of
21,597. In 1992 Bush's margin in Wheeling was 7,265
(more than a 14,000-vote decrease). The Bush drop in
Worth Township, located in southwest Cook County, was
even worse, with a 15,000-vote marginal drop. In sum,
suburban Cook County was a disaster for Bush.
Perot won over 20 percent of the vote in 12 suburban
Cook townships. His strength
was mainly in the northwest,
west and southwest parts of the
county. Perot did worse in townships having a significant number of Jewish, black and liberal
voters. Much like the Chicago
story, Perot ran best in strong
Bush areas and weakest in solid
Clinton areas. Perot received
over 10,000 votes in Maine,
Schaumburg, Wheeling and
Worth townships. It is highly unlikely that many of these voters
living in these largely conservative townships producing huge
turnouts would have supported
Clinton in a two-man race with
Bush.
In the five GOP-rich collar
counties, Clinton's percentages
mirrored almost exactly those of
Dukakis in 1988. Unfortunately
for Bush, history did not repeat
for him in the collars. The incumbent president had to share
his votes with Perot. Bush did not
receive a majority of the vote in
any collar county and in fact lost
a collar county (Will) to Clinton.
In 1988 the collars gave Bush a
254,000-vote margin over Dukakis. Four years later Bush's
collar margin was 107,000 votes a decline of nearly 150,000 votes.
Perot received over 20 percent of the collar vote (his
strongest regional showing in the state). He ran best in
McHenry County where he came within fewer than 3,000
votes of beating Clinton for second place. Even more than in
suburban Cook County, Perot's collar county numbers suggest that his candidacy hurt Bush.
|
Table3
1992 presidential vote in Illinois
|
| |
Clinton |
Bush |
Perot |
| Chicago |
|
|
|
| Votes |
793,272 |
199,972 |
102,104 |
| Margin |
593,300 |
|
|
| Percent |
72% |
18% |
9% |
| Wards won |
49 |
1 |
0 |
| Suburban Cook County |
| Votes |
456,261 |
405,328 |
179,895 |
| Margin |
50,933 |
|
|
| Percent |
44% |
39% |
17% |
| Townships won |
12 |
18 |
0 |
| Collar counties |
| Votes |
325,241 |
432,648 |
201,007 |
| Margin |
|
107,407 |
|
| Percent |
34% |
45% |
21% |
| Counties won |
1 |
4 |
0 |
| Downstate counties |
| Votes |
878,576 |
696,148 |
357,509 |
| Margin |
182,428 |
|
|
| Percent |
46% |
36% |
19% |
| Counties won |
72 |
24 |
0 |
| Illinois total |
| Votes |
2,453,350 |
1,734,096 |
840,515 |
| Margin |
719,254 |
|
|
| Percent |
49% |
34% |
17% |
| Counties won |
74 |
28 |
0 |
Note: All percentages are based on the vote for the
three major candidates. Percentages may not equal
100 percent due to rounding off.
|
|
The 96 downstate counties gave Clinton a comfortable
182,000-vote margin over Bush. The Democrat carried three
times as many downstate counties as his Republican opponent and beat him by 10 percent overall.
Key to Clinton's strong downstate showing was his
robust performance in Madison and St. Clair counties in southwestern Illinois near St. Louis. These
historic twin towers of Democratic downstate vote power
combined to give Clinton a staggering 52,000-vote margin
over Bush. Rock Island County in northwestern Illinois also
produced big time for the Arkansas governor, coming in with
a 14,200-vote margin. By and large Clinton ran strong in
many large downstate counties, winning 11 of them by more
than 5,000 votes. Special mention should be given to
Franklin County in southern Illinois. Although only the 23rd
largest county in registered voters among the downstate 96,
Franklin gave Clinton his seventh best margin (7,240 votes).
Downstate results suggest that
cartographers look into the location of the northern boundary of
Arkansas because in southern Illinois Clinton ran like a native
son. In percent of the vote, nine
of Clinton's top 10 counties were
in Little Egypt, and almost all of
the state's southern tier counties
gave the Democrat at least 50
percent of their vote. Overall
Clinton won a majority of the
vote in 26 of the 96 downstate
counties.
Bush was unable to win a
majority of any downstate county. He did best in central Illinois
and in traditional GOP strongholds around the state. The president's biggest victory margin
was in Kendall County where he
received a 3,098-vote margin
over Clinton. (The Arkansas
governor beat Bush's Kendall
County margin in 20 counties).
Except for southern Illinois,
Perot ran fairly consistently
throughout Illinois. Though he
was unable to win a quarter of
the vote in any single county, he
did receive over 20 percent of the
vote in 40 counties scattered
|
February 1993/Illinois Issues/27
throughout the state. However, far southern Illinois rejected
Perot's message as counties like Pulaski and Alexander
gave the Texan only 11 percent of the vote .
In sum, Illinois gave Clinton an overwhelming 15 percentage point victory. Bush's candidacy was dismissed.
Incredibly, only a little more than a third of the voters
supported his reelection. Perot was simply not competitive
anywhere in the state, but his relatively strong areas were
places where Bush had to do well.
|
In Illinois' U.S. Senate race, Braun whipped Williamson
by a three-to-one margin in her hometown of Chicago.
In winning 44 city wards Braun crushed Williamson by
over 558,000 votes (see table 4). Clearly, Braun's strength
was greatest in the African-American wards which gave her
Harold Washington-like support. Eleven black wards gave
her over 20,000-vote margins (wards 8 and 21 gave her
almost 30,000-vote margins), while 12 other black and
lakefront wards produced over 10,000 vote margins for
Braun.
In percentages, Braun almost pitched a no-hitter in black
Chicago. Eight wards gave her an
eye-popping 99 percent of their
vote, while 10 others came in with at
least 90 percent support for Braun.
Along the lakefront Braun's percentages ranged from 60 percent to 80
percent. Only in the ethnic northwest and southwest wards did Braun
face major Williamson opposition.
And even here she did remarkably
well in such predominantly white
areas as the northside 50th and 40th
wards, as well as the gentrifying
47th ward. Obviously, her strategy
to downplay race and use gender as
a political rallying point proved
sound in many parts of Chicago and
in the rest of Illinois as well.
In Chicago, Williamson was
competitive only on the northwest
and southwest sides. Only the 41st
Ward (Bush's only city ward win)
gave him a sizable victory (5,608
votes). All of his other ward wins
were by narrow margins. Of the
city's 50 wards, Williamson received over 40 percent of the vote in
only 10 wards. Rejected in the minority community and along the
lakefront, Williamson had a real
campaign only in the old Reagan
Democratic wards, and even here
Braun battled him to a standstill.
One could only imagine how much
more disastrous the city returns
would have been for Williamson if
the media had not scrutinized and
publicized Braun's problems with handling questions on
her mother receiving unreported income while on Medicaid.
Braun almost carried suburban Cook County. Like
Clinton, Braun did extremely well in townships with substantial blocs of black voters, and also like Clinton, she ran
well in areas having sizable numbers of liberal and Jewish
voters. Evanston, Proviso and Thornton townships each
gave the Chicago Democrat margins of over 10,000 votes.
Evanston and Calumet townships (both having large black
populations) gave Braun 75 percent of their vote. Though
she triumphed in only nine of 30 suburban Cook townships,
Braun was surprisingly competitive in many of her losing
townships. In several north and northwest suburban
townships Braun held down Williamson's expected victory
margin. Whether this fact was due to Clinton's coattails,
Republican women crossovers or general disappointment
in her Republican foe's campaign, the political reality was
self-evident: Braun broke even in a voting region where
Williamson needed a landslide.
|
| Table 4 |
| 1992 U.S. Senate Vote in Illinois |
| |
Braun |
Williamson |
| Chicago |
| Votes |
809,621 |
251,403 |
| Margin |
558,216 |
|
| Percent |
76% |
24% |
| Wards won |
44 |
6 |
| Suburban Cook County |
| Votes |
484,819 |
503,542 |
| Margin |
|
18,723 |
| Percent |
49% |
51% |
| Townships won |
9 |
21 |
| Collar counties |
| Votes |
385,804 |
516,058 |
| Margin |
|
130,254 |
| Percent |
43% |
57% |
| Counties won |
0 |
5 |
| Downstate counties |
| Votes |
947,074 |
859,741 |
| Margin |
87,333 |
|
| Percent |
52% |
48% |
| Counties won |
55 |
41 |
| Illinois total |
| Votes |
2,627,318 |
2,130,744 |
| Margin |
496,574 |
|
| Percent |
55% |
45% |
| Percent of all* |
53% |
43% |
| Counties won |
56 |
46 |
* This percentage includes minor
candidates.
Note: Percentages are based on the vote for
the two major candidates. Percentages may
not equal 100 percent due to rounding off. |
|
As expected, the collar counties were Braun's weakest
region in the state. Nevertheless, she did well enough to prevent
Williamson from crushing her in this
bedrock GOP area. Lake and Kane
counties were pleasant surprises for
Braun. She held Williamson to less
than 20,000-vote margins in each
county, thereby preventing him from
building a gigantic base in the collars. Perhaps her only real collar
county disappointment was her loss
in Will County by almost 11,000
votes, despite the fact that Clinton
had carried the county against Bush.
DuPage County gave Williamson
more than half of his collar county
margin. Along with McHenry County it gave him nearly three-fifths of
its vote. However, as in the suburban
Cook townships, Williamson's victory margins even in these two collar
counties were below expectations.
28/February 1993/Illinois Issues
Given his suburban background and conservative philosophy, one would have believed that Williamson would have
done much better here against a liberal Chicago Democrat.
The most interesting aspects of the Braun-Williamson
results were the downstate returns. Braun carried the downstate 96 while winning a majority of the counties. Like
Clinton she ran big in Madison and St. Clair counties (over a
48,000-vote combined margin) and in other big counties
like Rock Island and Peoria. Clearly Clinton's southern
Illinois popularity spilled over into Braun's column since
she, like the Arkansas governor, smothered her opponent in
rural Little Egypt. In fact, throughout the 96 counties she
outdid downstate Democratic hero Paul Simon's performance against Chicago suburbanite Charles Percy in the
1984 U.S. Senate race. She won 55 counties, whereas Simon
had won 38 in 1984, which was a Ronald Reagan landslide
year in Illinois.
Williamson's downstate strength, like that of President
Bush, was in central Illinois, but his margins paled compared to Braun's. Vermilion County gave Williamson his
best downstate win, a 3,911-vote margin that would not
have made Braun's top 10 list. Williamson was also hurt in
counties with large universities. He was unable to win
traditionally Republican DeKalb and Knox counties, and
performed for a Republican poorer than expected in Jackson, Champaign and McLean counties.
All in all it was quite an election for Illinois Democrats.
Only the expected loss of their state Senate majority
tempered their elation. Clearly, top Democratic leaders will
now focus on the 1994 statewide elections. Though their
gubernatorial losing streak goes back almost two decades,
1992 demonstrated that a unified Democratic party can be
an awesome political force in Illinois. As one old Democratic warhorse told me privately on election night, "Today the
White House, tomorrow the statehouse."
Illinois Republicans were outhustled and outorganized in
1992. Party leaders could not overcome the divisiveness of
their national convention in Houston or the festering Perot
factor. For most Illinois GOPers the U.S. Senate contest was
a throwaway race from the beginning. Only Braun's upset of
Alan J. Dixon in the primary gave some statewide Republicans a glimmer of hope of actually winning a U.S. Senate
seat.
In the end Bush, not Williamson, was the great disappointment for prairie state Republicans. *
Paul M. Green is director of the Institute for Public Policy and
Administration, Governors State University, University Park. The
author thanks Chris Robling, commissioner, Chicago Election Board;
David Orr, Cook County clerk, and Pat Freeman, Illinois State Board
of Elections.
February 1993/Illinois Issues/29
|
